Inspecting rustc LLVM optimization remarks using cargo-remark
TL;DR: This post describes LLVM optimization remarks that can useful to help the compiler better optimize your programs. If you want to analyze remarks generated from compiling Rust programs, you can use the cargo-remark tool.
LLVM has this nice (although I think not very well-known) feature called Optimization remarks. It is a diagnostics subsystem within LLVM that lets various LLVM optimization passes emit notes (remarks) containing information about interesting things that happened during the compilation and optimization of your program. For example, a remark can say that a specific optimization (like inlining) was successfully applied to a function or a block of code (a passed optimization remark), or it can contain a result of some code analysis, e.g. how did the number of instructions of a function change after some transformation was applied to it (an analysis remark).
While these types of remarks can be interesting, probably the most useful remarks are
missed optimizations remarks. These can say something like
I tried to apply optimization X to function/statement/line Y, but it was not possible (because of reason Z).
This information can be quite valuable to you (the developer of the code), because if you are able to
refactor the code so that “reason Z” disappears, you can potentially unblock a critical optimization
and speed-up some part of your program. I find optimization remarks kind of fascinating, as they
enable you to have a conversation with the compiler with the goal of speeding up our programs.
Here is an example of a missed optimization remark from a short C program compiled with
clang -O2 main.c -c -fsave-optimization-record:
void foo();

void bar() {
    foo();
    // Missed: inline/NoDefinition (main.c:4:5)
    // `foo` will not be inlined into `bar`, because its definition is unavailable
}
How was this remark generated?
When you compile a C/C++ program usingclang with the -fsave-optimization-record
flag, it will store remarks in a serialized form into YAML files on disk. I took one remark from these
files, manually formatted it and pasted it into a comment into the source code above. You can see the
original serialized form of the remark below.
--- !Missed
Pass:            inline
Name:            NoDefinition
DebugLoc:        { File: main.c, Line: 4, Column: 5 }
Function:        bar
Args:
    - Callee:          foo
    - String:          ' will not be inlined into '
    - Caller:          bar
      DebugLoc:        { File: main.c, Line: 3, Column: 0 }
    - String:          ' because its definition is unavailable'
...
This specific remark tells us that a LLVM inlining pass was not able to inline (“copy-paste” the
code from) the function foo into the body of the function bar, because the definition of foo
is not available (only its declaration is). If we wanted to resolve this “issue”, we could provide
the definition of foo to enable the inlining to succeed (or enable Link-time optimization).
Utility of remarks
Optimization remarks can be quite “low-level”, and thus it is good to manage your expectations. You probably shouldn’t expect miracles from these remarks (more on this later in the post), as they won’t tell you something like “change this one line of code to make your program 2x faster”. Typically, resolving a missed optimization remark can result in e.g. a function being inlined, a loop being vectorized, or a few instructions of a function getting removed. These changes can have varying effects on the performance of your program, ranging from no change (or even a slowdown!), through a very small improvement (probably most likely), to a large improvement (if you manage to better optimize a critical tight loop).
It should be noted that looking at optimization remarks is something that you should probably only do when you have exhausted other approaches to optimizations, like algorithmical improvements, code architecture (re-)design, memory/cache optimizations and playing with compiler build flags. Remark-driven development can be quite brittle, because even if you resolve some remark, it can again regress (reappear) in the future, either through innocent-looking code changes or simply when you update your compiler.
One of the problems with remarks is that when you compile a non-trivial program with optimizations, LLVM will probably generate a very large amount (e.g. thousands) of remarks, and it can be quite difficult to navigate them. This is where tooling can help.
Existing remark tooling
When you compile a program using LLVM (clang) and enable remark generation, you will be presented with a bunch of YAML files containing serialized versions of these remarks. These files can be quite large (in the order of gigabytes for larger programs!), and so it’s not very practical to navigate them manually.
That is why in the C/C++ world, several remark analysis tools have been created. The latest (AFAIK) and probably most useful one is called optview2. If you are interested in it, I can recommend this wonderful talk presented by its author, Ofek Shilon.
As I have already shown, for C/C++ programs, you can generate remarks with clang and the
-fsave-optimization-record. But what about Rust? If C/C++ can do this, surely Rust can take some
inspiration :)
The Rust compiler has actually had support for outputting LLVM remarks for quite some time, using
the
-Cremark codegen flag. When
enabled, rustc will print LLVM remarks generated during compilation to stderr:
$ RUSTFLAGS="-Cremark=all -Cdebuginfo=1" cargo build --release
note: /.../foo/src/main.rs:5:5 inline: 'foo::foo' not inlined into 'foo::main' because it
  should never be inlined (cost=never): noinline function attribute
note: /rustc/90c541806f23a127002de5b4038be731ba1458ca/library/std/src/sys_common/backtrace.rs:130:0 size-info:
  Debug Variable Analysis: Function: std::sys_common::backtrace::__rust_begin_short_backtrace: MI Instruction count changed from 8 to 6; Delta: -2
note: /rustc/90c541806f23a127002de5b4038be731ba1458ca/library/std/src/sys_common/backtrace.rs:130:0 size-info:
  Virtual Register Rewriter: Function: std::sys_common::backtrace::__rust_begin_short_backtrace: MI Instruction count changed from 6 to 7; Delta: 1
note: /rustc/90c541806f23a127002de5b4038be731ba1458ca/library/std/src/sys_common/backtrace.rs:130:0 prologepilog:
  8 stack bytes in function
note: /rustc/90c541806f23a127002de5b4038be731ba1458ca/library/std/src/sys_common/backtrace.rs:130:0 size-info:
  Prologue/Epilogue Insertion & Frame Finalization: Function: std::sys_common::backtrace::__rust_begin_short_backtrace: MI Instruction count changed from 7 to 9; Delta: 2
note: /rustc/90c541806f23a127002de5b4038be731ba1458ca/library/std/src/sys_common/backtrace.rs:130:0 size-info:
  Live DEBUG_VALUE analysis: Function: std::sys_common::backtrace::__rust_begin_short_backtrace: MI Instruction count changed from 9 to 10; Delta: 1
note: /rustc/90c541806f23a127002de5b4038be731ba1458ca/library/std/src/sys_common/backtrace.rs:130:0 stack-frame-layout:
  Function: std::sys_common::backtrace::__rust_begin_short_backtrace
...
Note that I’m enabling debuginfo here, because without it the remarks will not contain precise code locations, which makes them quite useless. I’m also compiling with optimizations, otherwise there’s probably no point in analyzing the remarks.
We can also use a filter to only output remarks from certain optimization passes. For example, if
I was only interested in remarks regarding inlining, I could use -Cremark=inline.
Even though this flag was quite easy to use, I’m not sure that it was very practical, because there can be a lot of remarks, and it is quite difficult to make sense of the text-based output. I don’t have any stats for this, but I don’t expect that this feature saw much use.
Rustc remark improvements (-Zremark-dir)
I wanted to make it easier to analyze remarks generated by rustc, and to use the existing
visualization
tools (like optview2), so I decided to implement a new flag that would instruct rustc to output
remarks in more or less the same YAML format as is used by clang. The PR that implemented this
feature can be found here. Thanks @tmiasko for the quick and helpful review!
If you want to try it, you will need a build of rustc newer than 3rd of July 2023
(e.g. nightly-2023-07-06).
The feature is currently unstable and can be accessed under the flag -Zremark-dir, which should be
used in combination with the existing -Cremark flag:
$ RUSTFLAGS="-Cdebuginfo=1 -Cremark=all -Zremark-dir=/tmp/remarks" \
  cargo +nightly build --release
When you use this flag, rustc will no longer output the remarks to stderr, but instead it will
write them into a set of YAML files (basically several YAML files per each
Codegen Unit) in the
specified directory.
First, I thought that my job is done here. Rust programmers will be able to use this flag to generate optimizations remarks stored in a well-supported format, and potentially act on them. But then I tried to actually use it on one of my Rust projects from work and quickly realized several things:
- Rust is not C/C++ (duh). There are several Rust specific things in the remarks that will probably not be handled well by tools designed for C/C++. For example, Rust function names in remarks are mangled with Rust-specific mangling. Therefore, without using a Rust-specific demangler, they won’t be pretty-printed correctly. Also, there will probably be some weird remarks generated by Rust programs specifically, which should be ideally filtered out to reduce noise. Users also might want to filter remarks based on crates and their dependencies (which is not really an existing concept in the C/C++ world).
- If someone wanted to use
optview2to view the remarks, they would have to manually download it, set up a Python virtual environment (optview2is written in Python), manually pass the correct flags torustc/cargoand then thread the results into the tool. That can be quite annoying, and it’s far from the typicalcargo <...>frictionless experience. - Because
optview2is written in Python, it can sometimes take a lot of time to analyze large amount of remarks with it. It doesn’t help that the remarks are serialized in YAML, which is painfully slow to parse.
Therefore, in good Rust tradition, I decided to Rewrite it in Rust make this easier by creating
a Cargo subcommand that would do all these things for the user. Enter cargo remark.
Cargo remark
cargo remark is a Cargo subcommand that automates the
process of generating LLVM optimization during the compilation of a Rust crate and displaying the
remarks in a (hopefully) understandable way. Luckily, it is
quite easy to add new subcommands to Cargo,
so the only thing that you have to do to use it is to install it with the following command:
$ cargo install cargo-remark
And then run it on your crate with the build subcommand:
$ cargo remark build
This will do several things:
- Compile your crate with remark generation enabled.
- Parse the generated remarks.
- Generate a static website visualizing the remarks.
Steps 2. and 3. are parallelized, which helps with performance, but it can still sometimes take several seconds or more to get the final result.
There are several CLI flags that you can use to modify the behavior of cargo remark, you can find
them in the README.
Once the command finishes, you can examine the generated website. It contains two main pages. The index page contains a list of source files with remarks, you can use it to go to a specific file and examine its remarks. The remark list page contains a table of all found remarks, you can filter by function or remark pass and quickly go to a specific line with the remark:
Combining remarks with PGO
If you compile your crate using Profile-guided optimization,
LLVM is able to associate “hotness” with some remarks, which determines how important is that remark
(or rather, how important is the code that the remark is concerned about). I added support for
adding hotness to remarks in this PR, and it is
available starting from nightly-2023-08-09.
To generate remarks with hotness, you have to compile your crate with PGO optimizations. If you
combine cargo remark with cargo-pgo, then it is quite
easy to do:
# Compile with PGO instrumentation
$ cargo pgo build

# Gather PGO profiles
$ ./target/release/<target>/<binary> <workload>

# Compile with PGO optimizations and generate remarks
$ cargo remark wrap -- pgo optimize
The cargo remark wrap allows wrapping an arbitrary cargo command, while instructing it to generate
the remarks.
A sad realization…
When I was working on cargo remark, I was quite excited. Everything seemed to work nicely, the
remarks were generated by rustc in the expected format, I was able to parse them and display them,
and I was making a lot of progress1. However, to be honest, once I had a reasonably working version and I
started using it on real crates, my excitement has waned a bit.
Why? Basically, because I personally couldn’t make as much sense of the remarks as I have originally expected.
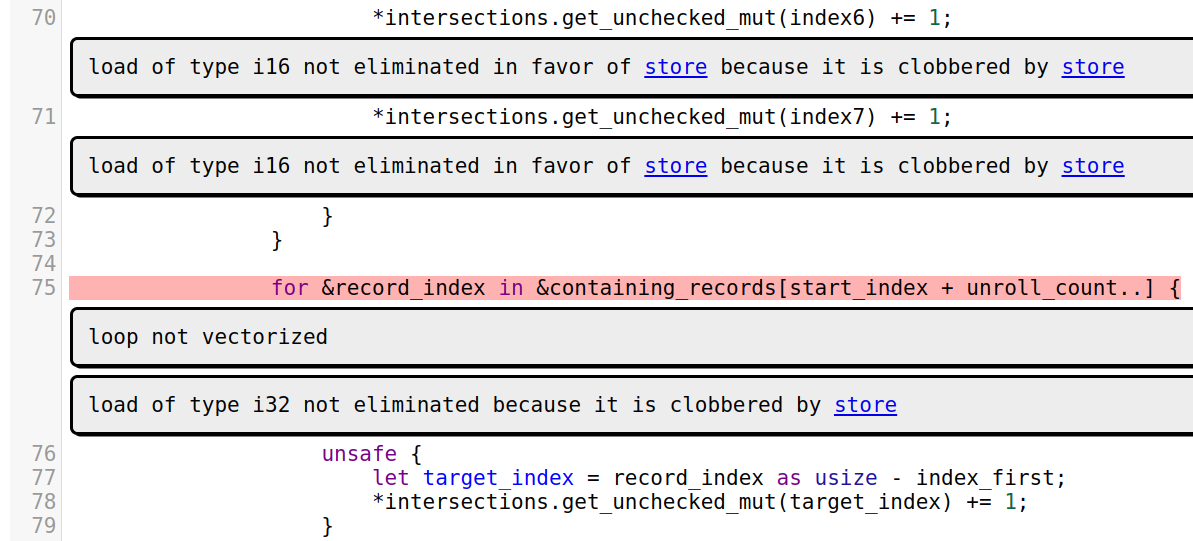
- Even after applying various default filters and providing a GUI to search and filter the remarks, there is still a lot of data to go through. Individual source files can contain hundreds of remarks, and it’s unclear which ones are important and which are just noise. Often there is also a myriad of remarks contained on a single line of Rust, which makes it difficult to make sense of what is going on even if you focus on a single location.
- Understanding the remarks is quite challenging. What even is
FastISelFailureorSpillReloadCopies? How can I change my Rust code to resolve these remarks? Hard to say if you’re not a LLVM expert. The remarks are already quite opaque to people not familiar with LLVM, but when applied to Rust code, they can be outright arcane (at least to me). I suspect that it’s mostly because Rust code is typically more abstract and higher-level than the corresponding C++ (or C) code, and the mapping between the optimized LLVM IR and the original Rust code is often very complicated. Furthermore, the massive amount of inlining happening when you turn on optimizations means that it can be quite challenging to even find the original source code location that you might want to modify.
That’s not to say that I consider cargo remark useless ![]() There are some cases where the
remarks can still be relatively straightforward, e.g. when a function call is not being inlined because
of too low inlining threshold or a missing
There are some cases where the
remarks can still be relatively straightforward, e.g. when a function call is not being inlined because
of too low inlining threshold or a missing #[inline] attribute. And I hope that to developers with
more knowledge of LLVM, it can provide a useful way of examining optimizations being performed on
Rust code. I also see greater potential for this tool in the future (see below). It’s just that at
the current state, it hasn’t really fulfilled my original expectations.
If you have any hints on how to better interpret these remarks, let me know. Of course, I will also
be happy for any experience reports from using cargo remark by other Rust developers.
…a bright future?
While currently I may not be convinced of the general usefulness of LLVM remarks for Rust programs,
I think that there is an opportunity to create our own2, Rust-specific remarks. The Rust
compiler uses an intermediate representation called MIR, which contains many optimizations
tailored for idiomatic Rust code. In theory, if we added the necessary infrastructure, we could generate
“MIR remarks”, which could be more useful and less opaque to Rust developers. Hypothetical
examples of how could MIR remarks look like, with a clippy-like text (completely made up, of course):
- An unnecessary memcpy of a large type is generated on this line. Consider passing a reference instead.
- This iterator chain was not able to be fully optimized. Consider removing
&from this argument.
The existing Rust linting tool (clippy) already provides various performance hints, but it is
currently not integrated with MIR optimizations. If it was, that could in theory take the usefulness
of these performance remarks to another level.
If you have some hints on how to better interpret these remarks, feature suggestions for cargo remark
or any comments, let me know on Reddit or on the crate’s issue tracker.