How to improve Rust compiler's CI in 2023
During the first half of 2023, I have continued my quest for optimizing the build, test and performance monitoring infrastructure of the Rust compiler. This post describes what has been done in this area, and serves a follow-up to my previous post on this topic. Note that possibly the biggest sub-project that I have worked on was the implementation of runtime benchmarks for the Rust benchmark suite, however I will dedicate a separate blog post for that (which I will hopefully publish in the near future).
The name of this blog post was inspired (with permission
) by the awesome blog series by Nicholas Nethercote.
My work on these infrastructure improvements has been kindly sponsored by a Rust Foundation
project grant
and also by Futurewei. I’m also thankful to many other contributors that have helped me tremendously
in my efforts, such as @nnethercote, @lqd,
@jyn514, @Mark-Simulacrum, the whole
infrastructure team and many others.
The stuff that I have been working on could be divided into three categories: Rust compiler (rustc)
build configuration, Rust benchmark suite (rustc-perf)
and rustc continuous integration workflows. I’ll go through these in turn, again in an “almost,
but not-quite” chronological order. There will be a lot of PRs and links, so strap in!
Optimizing build configuration of rustc
This section describes my attempts to speed up rustc by modifying its build configuration (i.e.
the way the Rust compiler itself is compiled). This is performed via the “PGO script” - a program that
builds rustc in the most optimized way possible, using various techniques and tools, such as
Profile-guided optimization and BOLT. The current
state of rustc build configuration is tracked in this issue.
Follow-up to items from last post
Let’s start where the previous post (published in autumn of 2022)
has ended. By then,
we have just enabled Link-time optimizations (LTO) for rustc and managed to optimize LLVM
with the BOLT tool. First, I’d like to go through the list of items that I have marked as
“possible future improvements” at the end of the post:
- Use BOLT to optimize
rustc(#102487): I hope that we will be able to enable this later this year. The performance results are not as good as when we optimized LLVM with BOLT, but they still look quite nice. - Use PGO on more platforms: Sadly, PGO is still performed only on Linux and Windows. The duration of macOS CI workflows has actually been optimized quite nicely (more on this later in the post), however we hit some issues with correctly matching symbols when doing PGO on macOS the last time we have tried this. macOS is thus still without PGO for now, but we definitely plan to revisit this sometime in the future.
- Use LTO on more platforms: LTO has been enabled on macOS and Windows (thanks to the great work of @lqd). However, it has since been disabled on Windows, because it was found out that it produces miscompilations. If there are any Windows experts around, I would invite you to try and investigate what could be done to fix this :)
- Enable call-site aware PGO (CS-PGO) for LLVM (#111806): Call-site aware PGO is a more advanced PGO mode that should provide some additional wins on top of “regular” PGO. I have been trying to use it on LLVM, but I haven’t had any success (there were no perf. wins). After discussing this with the BOLT maintainers, I reached a conclusion that the optimizations performed by BOLT basically supersede CS-PGO, therefore I decided to abandon this effort.
- Use Fat LTO to optimize
rustc(#103453): as stated in the previous post, there were no real perf. wins, and the CI build time hits were quite big, so I also decided to abandon this. - Use LTO for
rustdoc(#102885): I haven’t been able to get any perf. wins, possibly because most of the work done byrustdocis actually spent inside the compiler, which is already LTO optimized. - Use PGO for
libstd(#97038: Didn’t seem to work, and I’m not sure if it makes sense to PGO optimize the standard library, since it’s quite general (and also quite generic, and thus often codegened inside the crates that uses it). Again, I decided to abandon this for the time being.
Rewrite the PGO script in Python (#103019)
The last remaining point in that list was a rewrite of the PGO script in Python, which is basically
also the only thing from that list that has been fully completed since ![]() .
This was a much-needed maintainability improvement. Previously, the PGO script was written in
bash,
and it was a bit hard to modify and extend it, since it was already getting quite complicated. I also
wanted to add some better monitoring of the build process, which would involve parsing JSON generated
by the
.
This was a much-needed maintainability improvement. Previously, the PGO script was written in
bash,
and it was a bit hard to modify and extend it, since it was already getting quite complicated. I also
wanted to add some better monitoring of the build process, which would involve parsing JSON generated
by the rustc build system (called bootstrap), and I definitely didn’t want to implement that in bash :)
That’s why I ported the whole thing to Python in this PR. Thanks to @geordi
for helping me with the Python rewrite!
This allowed me to easily add new features useful for debugging the PGO CI workflow, like observing
file disk usage of the PGO profiles (#107922) or
printing a timing table that tells us exactly how much time do individual parts of building
rustc take (#107596, #107733):
------------------------------------------------
Stage 1 (LLVM PGO):            1936.16s (21.44%)
  Build rustc and LLVM:        1447.07s (16.02%)
    LLVM:                       322.39s ( 3.57%)
    Rustc:                     1105.31s (12.24%)
  Gather profiles:              489.10s ( 5.41%)
Stage 2 (rustc PGO):           1579.59s (17.49%)
  Build rustc and LLVM:         650.87s ( 7.21%)
    LLVM:                       290.31s ( 3.21%)
    Rustc:                      342.16s ( 3.79%)
  Gather profiles:              928.72s (10.28%)
Stage 3 (LLVM BOLT):           2722.61s (30.14%)
  Build rustc and LLVM:        1892.67s (20.95%)
    LLVM:                      1141.65s (12.64%)
    Rustc:                      725.08s ( 8.03%)
  Gather profiles:              829.94s ( 9.19%)
Stage 4 (final build):         2794.01s (30.93%)
  LLVM:                         984.42s (10.90%)
  Rustc:                        414.21s ( 4.59%)

Total duration:                       2h 30m 32s
------------------------------------------------
Notice the time in the last row. In February this year, it took two and a half hours before an
optimized 64-bit Linux build of rustc was finished. This meant that:
- It took at least 2.5 hours to run CI on a merge commit. Therefore, we couldn’t perform merges more often than that. However, this specific CI workflow wasn’t even the bottleneck on CI at that time! So this was not that important.
- When a
rustccontributor started a so-calledtry buildon a PR, which is used for running performance benchmarks of a specific compiler version, it took at least 2.5 hours before they received feedback on whether the build was successful, and before a perf. benchmark of that build could start.
I have considered this 2.5 hour latency to be too high, so I set as my next goal to reduce this duration as much as possible. I was actually partially responsible for this long duration, because my extensions of the PGO script that I have implemented last year have increased the try build duration considerably!
Notice that at this state, each execution was building LLVM 4 times (!), and rustc was also being
built 4 times (actually, 8 times because it’s a two stage build, but let’s not get into that).
Do not rebuild LLVM before BOLTing it (#107723)
We have been rebuilding LLVM for the BOLT optimization step, but this was actually quite wasteful, since BOLT operates on compiled binaries/libraries. Therefore, we don’t need to build a new copy of LLVM to optimize it with BOLT, we can simply reuse LLVM built in a previous step of the PGO pipeline. I implemented exactly this change in this PR, which helped us avoid one LLVM rebuild.
This change wasn’t trivial, because of weird interactions with the way bootstrap (the
rustc build tool) performs caching. The main problem was that we could not BOLT instrument
the LLVM library in-place, because bootstrap would then continue using the instrumented version
in follow-up steps, which was not at all what we had intended. It didn’t help that bootstrap aggressively
uses hard links1, which has caused me to bang my head against the wall on many occasions
(“why does this completely unrelated file on disk keep changing?”).
I don’t actually remember how much time has this change saved, since the CI logs on GitHub are no
longer available ![]() , but according to the timing table, it should have been around 15-20
minutes.
, but according to the timing table, it should have been around 15-20
minutes.
Avoid building unneeded components (#111660)
As the saying goes, the fastest code is code that does is not executed at all. By examining the timing
tables and other CI logs, I realized that try builds compile a lot of components (like documentation,
or clippy) which are not in fact needed to execute a perf. benchmark of the compiler. In this
rather simple PR, I simply turned off the compilation of several components if we’re doing a try
build, which sped up the PGO pipeline approximately by an additional 10 minutes.
Optimize ordering of building rustc (#112012)
The last post went into detail about which steps does the PGO pipeline actually perform and in which order. There has been some room to optimize this ordering, but I wasn’t sure what would be the best approach. Luckily, Nikita Popov (the resident LLVM wizard), has suggested a much better ordering for the pipeline, which would make sure that we do not perform any unnecessary rebuilds.
I implemented this suggestion in this PR, which enabled us to actually remove two (!) rustc
rebuilds from the pipeline, and thus save about 15 minutes of CI time for each PGO build. In the end,
the change was quite simple, so it was a bit embarrassing for me that the pipeline has been doing
so much wasteful work for so long. But hey, at least it’s fast now! Without much context (this blog
post is already quite long, and we’re not even in the middle), here is the updated pipeline order:
- Build LLVM.
- Build PGO instrumented
rustc. - Gather
rustcPGO profiles. - Build
rustcwith PGO use (reuse old LLVM). - Build PGO instrumented LLVM (reuse old
rustc). - Gather LLVM PGO profiles.
- Build PGO optimized LLVM (reuse old
rustc). - Instrument LLVM from step 7. with BOLT (reuse old
rustc). - Gather LLVM BOLT profiles.
- Optimize LLVM with BOLT.
- Build a final distribution archive (reuse old
rustcand LLVM).
Edit: I have been asked
on Reddit why do we re-build and re-profile LLVM with PGO and BOLT on every merge, instead of just
caching the optimized LLVM library (since LLVM itself is changed only very rarely, unlike rustc).
We could do that in theory, and I have been planning to try it for some time (let me know if you’re
interested in trying this out! ![]() ). But it’s important to note that it would be a trade-off.
Currently, we always PGO/BOLT profile and optimize LLVM according to how it’s being used by the actual
version of
). But it’s important to note that it would be a trade-off.
Currently, we always PGO/BOLT profile and optimize LLVM according to how it’s being used by the actual
version of rustc. When rustc changes, its usage patterns of LLVM can also change, and thus using
a version of LLVM optimized by an older version of rustc could result in less efficient optimization.
That being said, I suspect that the LLVM usage patterns actually don’t change all that much, so it could be a worthwhile thing to try. There are some additional concerns about introducing noise into benchmark results, because if we would be updating the LLVM build only sparingly from time to time, each such update could add unexpected changes to benchmark results. Now LLVM is re-optimized on each merge, which can also add noise, but at least it’s more predictable and the changes are usually small and incremental.
Build LLVM without LTO (#113779)
Removing an optimization from LLVM might sound a bit scary, but don’t worry, it doesn’t affect the
performance of rustc in any way! If you have examined the timing table printed above, you might
have noticed something weird - how is it possible that some (re)builds of LLVM take 1000+ seconds,
but some are finished in only about 300 seconds? The answer is sccache, a distributed caching system
that we leverage on our CI to speed up LLVM builds (among other things).
sccache is able to very effectively cache normal and PGO instrumented builds of LLVM, because
these are deterministic and should produce the exact same artifacts, as long as nothing in the LLVM
codebase has changed (and the host compiler/flags/etc. have remained the same). These are the fast
builds that take ~300s. However, the PGO optimized LLVM build cannot be cached very well, because
it uses PGO profiles, which are regenerated (and thus are different) on every CI pipeline execution!
I have known before how this works, and I considered sccache to be something that is simply present
on CI and that I don’t have to care about. However, once I was running out of ideas how to further
speed up the PGO pipeline, I have looked at what exactly happens during these 300s when LLVM is built.
I looked at how long does it take to compile LLVM in the logs… and the answer was about 5 whole seconds
![]() ! So what was going on in the remaining time? Yup, it was linking. More specifically, the time
was spent performing link-time optimizations (LTO) during the linking step, which (AFAIK) aren’t cached
by
! So what was going on in the remaining time? Yup, it was linking. More specifically, the time
was spent performing link-time optimizations (LTO) during the linking step, which (AFAIK) aren’t cached
by sccache.
It seemed wasteful to have near-instant compilation and then a 5-minute linking step in each PGO pipeline run, so I tried to disable LTO for the first LLVM build that we do at the very beginning of the pipeline. And sure enough, the initial LLVM build time went down to ~70 seconds! A very nice win for a small code change.
As I stated before, this change doesn’t have an effect on the performance of rustc, because this
initial LLVM is only used to build PGO instrumented and optimized versions of rustc, and then it
is thrown away. It is thus not used by the compiler for performing actual codegen of Rust crates.
It does, however, make these two rustc CI builds slightly slower, but the gain from the faster LLVM build
is still worth it (in the end, it is about 3-4 minutes faster in total).
As already mentioned, we perform two LLVM builds that are well optimized by sccache. So why was this
change not performed also for the PGO instrumented build? Well, when we gather PGO profiles, we should
compile LLVM with the same flags and options as we will eventually do for the final, PGO optimized
build, otherwise we would gather profiles on a different version than the one that we optimize, which
probably wouldn’t work ideally. Therefore, we need to optimize LLVM with LTO when we build it with PGO
instrumentation, because we of course want to optimize it with LTO when we build the final, PGO optimized
version. I know, I know, my head also spins from all these different kinds of builds :)
Rewrite the PGO script in Rust (#112235)
If you have looked at the latest mentioned PR with the LLVM LTO removal, you might have noticed something weird about it - it was modifying Rust, not Python code! Yup. Just a few months after I have rewritten the PGO script in Python, I rewrote it again, this time in Rust2. This provided us with several benefits:
- Not all Rust contributors might know Python, so writing this tool in Rust potentially expands the set of people that might be willing to work on it.
-
I really wanted to use some nontrivial dependencies in the script (a REST client, various file system or formatting utilities, potentially an S3 client in the future), and it turns out this is somewhat easier to do in Rust than in Python. In theory, I could have slapped a
requirements.txtfile next to the script and call it a day, but it wouldn’t be that easy - the script was used in CI running under Linux and Windows, with different Python versions, and different CI entrypoints where I would always need to install the dependencies from scratch. People using the script locally would also have to install the dependencies somehow. Because of that, I shunned dependencies and wrote everything by hand, which was quite annoying.Obviously, it would have been possible to add dependencies to the Python version, but it just didn’t seem to be worth it. I’m always a bit annoyed when I have to set up Python dependencies for a project, expecially since the experience is much worse than with Cargo. Having a default “blessed” Python package manager would go a long way!
- Having compile-time checks for the script is quite useful. The script is typically only executed on CI, and it can take hours before it finishes. If you thus make a silly type error, it’s much nicer to get an immediate compiler error rather than to wait an hour to find out. I was trying to use types heavily in the Python script (you could say that I wrote it as Rust), but even with that, silly errors resulting in CI failures weren’t that uncommon. With the Rust version I feel much more confident that the script will work.
So, why didn’t I rewrite it in Rust in the first place? It was even suggested to me in the Python rewrite PR! Again, there were a few reasons:
- I thought that since it is a “script”, it would be too verbose to write it
in Rust and a scripting language was a better fit. I was wrong - ignoring stuff like the contents of
Cargo.lock, the initial version of the Rust port was even a few lines shorter than the Python version, even though the Python code was all in a single file and the Rust code was separated into several modules! This was mostly thanks to the usage of dependencies - I suddenly didn’t have to write my ownhumansizeformatting routines by hand. - I didn’t like the idea of the PGO script being included in
bootstrap, because it itself invokes thebootstraptool several times, and that wouldn’t behave well. I had this right - it wouldn’t be a good idea to add the script logic tobootstrap. But that doesn’t mean that it cannot be in Rust! What I didn’t realize is that I could simply write the script as a standalone Rust tool outside ofbootstrap, and put it under thesrc/toolsdirectory. This is obvious in hindsight, but it didn’t occur to me at first. - And finally, by the time I even got the idea to write it in Rust (when this was suggested to
me in the PR), I already had the Python port finished
 So I decided to go forward with it first.
Anyway, I think that the rewrite was a clear win, the code is now much better structured and documented, and we can catch silly progrmaming errors locally, rather than in CI. It took a while to get the PGO script to the current state, but luckily I suppose that this was the final rewrite, given that it’s now written in Rust :)
Reducing the size of LLVM (#114141)
Recently I got into touch with several BOLT maintainers on the LLVM Discord
and asked them how we could improve our usage of BOLT. One of the annoying things caused by BOLT is that the
size of the libLLVM.so file grows from ~100 MiB to ~170 MiB after being optimized with BOLT, which
is a non-trivial increase.
The BOLT maintainers advised me to use the --use-old-text flag, which helped to reduce the size
of the distributed LLVM library back to ~115 MiB, without any apparent regressions! Not a bad result
for a two-line change PR.
Some issues with BOLT still remain though. For example, the BOLT optimized LLVM stops working
if you strip it. There is a BOLT
patch in progress which should resolve the issues with strip
and also hopefully produce smaller binaries by default.
Running tests on optimized artifacts (#111495)
This PR was not concerned with performance, but rather with correctness. Rust CI runs a lot of workflows
that execute various tests on various architectures, which helps us catch regressions and issues quickly.
However, the testing workflows are separated from the so-called dist workflows, which prepare archives
with artifacts that are then actually distributed to end users (e.g. via rustup). For most build
targets, this is not a big issue, because the distributed artifacts and the artifacts that we test
should be more or less the same.
However, for 64-bit Linux GNU (which is probably the most commonly used Rust target), the distributed
artifacts are quite different - because they are optimized by the PGO script! Therefore, if
some issue was introduced e.g. by LTO, PGO or BOLT, we might not actually realize this on CI right
away, which is quite bad. Such issues would hopefully still be found soon-ish, and before arriving in
stable, because a lot of users use nightly builds, and we also run each merged commit through perf.
benchmarks, so if they e.g. failed to compile something, we would notice it.
However, we don’t run perf. benchmarks on Windows, and I’m pretty sure that there are fewer Rust Windows
nightly users than Linux nightly users. And sure enough - as I mentioned earlied in the post, Windows
was the “victim” of a miscompilation caused by the introduction of LTO, which went unnoticed for
several months (!), before it appeared on stable and basically broke any Rust program that used a
string ![]() .
.
Note that the LTO miscompilation on Windows was caused specifically by our internal usage of the (unstable) feature for LTO optimizing Rust
dylibs (-Zdylib-lto). I think that using LTO for optimizing standard Rust binaries on Windows should be fine.
This motivated me to do something about this. In this PR, I added a final step to the PGO script,
which extracts the generated distribution archives, builds a sysroot that should hopefully correspond
exactly to the one that will be downloaded by users, and then runs a (rather large) subset of the
test suite, to make sure that the tests still pass even with the heavily optimized compiler. The test
suite wasn’t really prepared to run on an externally provided compiler sysroot, so it was not trivial
to get this working, but thanks to the help of @jyn514 and others, I
was eventually able to get it working.
I was also able to confirm that these tests would be able to discover the Windows LTO miscompilation on CI, which (slightly) reassured me that this testing could help us find similar issues in the future much sooner.
Apart from the mentioned completed improvements, I would also like to mention two build configuration changes that are currently in progress.
Building rustc with a single CGU
Currently, each crate of rustc is built with the default value of 16 codegen units,
with the hope that LTO will eventually optimize them. In theory, compiling each compiler crate with
just a single codegen unit should improve the performance of the compiler, at the cost of slower
CI build time (although the build time hit was negligible the last time we have tried this).
The latest attempt to use this setting is #107651. Although the latest performance results were a bit mixed, I will probably revisit this soon, after support for LLVM 17 will land.
Enable more modern instruction set
Currently, the Rust compiler for 64-bit Intel/AMD Linux targets is compiled with the x86-64-v1
microarchitecture level. This
means that it can only leverage the SSE and SSE2 instruction set extensions, but not e.g. SSE3,
AVX/AVX or even AVX512 extensions, which are available in levels v2, v3 and v4, respectively.
From time to time, we try to do a perf. run to see how much would raising the level e.g. to
v3 help with performance. The latest (AFAIK) results can be seen here.
It’s about a ~2% improvement in cycle count across the board. Which is not bad, but it also hasn’t been
incredible enough so far to warrant the level increase. It is a bit of a “chicken and egg”
problem - the level isn’t raised because the perf. wins aren’t that good, but the perf. wins aren’t that good
also because we can’t currently use these instructions directly, and have to depend e.g. on auto-vectorization.
But why should we be opposed to raising the level at all, when there are obviously some perf. wins?
There is a balance to be struck here. If we use a higher level, the compiler will be able to use more
modern instructions and thus in theory be faster. However, this also means that the CPUs on which the
compiler will be executed will need to support these instructions, otherwise they will not be able to
run rustc! Currently, by using v1, the compiler is quite conservative, and supports very old
CPUs3, basically going back ~20 years. That’s not to say that some of the higher levels are “too
modern” - if the level was raised to v2, then still every x64 Intel/AMD CPU manufactured after ~2009
should support it, and if the level was raised to v3, that year changes to ~2015, which is already
almost ten years ago. However, it’s possible that if we did indeed raise the level, (probably a very
small) set of Rust users could be unhappy about that, as their CPU could no longer run rustc.
In theory, we could distribute multiple versions of the compiler for different instruction sets, but that would be a non-trivial distribution/rustup challenge, and as mentioned, so far the perf. wins haven’t been compelling enough to motivate work on this.
Eventually, I think that we will raise the level simply because we will (maybe even soon) reach a
time when there are no Intel/AMD CPUs that support our minimum Linux kernel/glibc versions
(which were increased
a year ago), but that wouldn’t at the same time also support v2 or v3. If that happens, then
there is no point in keeping using v1. We just have to notice when this crossover point happens :)
What didn’t work
I also had several other ideas how to speed up try builds, which didn’t work out:
- Build only the x86 target of LLVM in try builds (#107639): Normally, we build LLVM that can produce machine code for several architectures (like x86, ARM, etc.), but in try builds we really only need the x86 backend. I tried to remove the other backends in this PR, but it didn’t seem to have a noticeable impact on CI time. It’s a bit hard to measure these things, because each GitHub action CI workflow can run on a slightly different machine with different performance characteristics, and we cannot really affect that, therefore sometimes it can be hard to find out if a change is actually an improvement or not.
- Use ThinLTO or PGO for the host LLVM compiler (#111779):
We make our target LLVM (the one used by
rustc) faster by optimizing it with LTO, PGO and BOLT, and this in turn makes compiling Rust crates faster. So, why not optimize the host LLVM compiler on CI with the same techniques, thus making it faster to build our target LLVM and speeding up CI? Well, because it’s complicated Doing the whole LTO/PGO/BOLT dance once is complex, doing it
twice is… probably just not worth it. We build our host LLVM in a Dockerfile, with a limited manoeuvrability
space. I couldn’t get PGO (using the preconfigured clangCMake PGO target) nor LTO (because we compile the host LLVM with GCC, so ThinLTO can’t be used) to work, so I gave up. I don’t think that the gains would be worth it, anyway. -
You might have noticed that we perform PGO in two steps - first we gather profiles for LLVM, and then, separately, for
rustc. Why don’t we just merge these two steps, PGO instrument both LLVM andrustc, and then gather profiles for both together? Well, it turns out that it originally used to work that way, but it has caused issues, so it was later split. What is the problem? A different version of LLVM. We use two version of LLVM on CI. The host LLVM compiles our in-tree fork of LLVM (that I call “target LLVM”), and the target LLVM is then further used to compile Rust crates (and alsorustcitself!). Therefore, unless the host and target LLVM versions match up exactly (which they often don’t), problems can arise from having two different versions of the instrumentation machinery running within a single process.This has actually caused issues again recently. When trying to update the host LLVM to version 17, there were massive regressions. But as soon as I tried it with the target LLVM also having version 17, the regressions were suddenly gone. How is that possible when we’re doing PGO separately? It turns out that we were using the
llvm-profdatabinary from the host LLVM toolchain for merging both LLVM andrustcprofiles in the PGO script, while we should have been using the target LLVM version for therustcprofiles (thanks again to @nikic for realizing this!). This was actually working fine for the last several versions of LLVM, but with LLVM 17, it apparently broke PGO. Resolving this (#114344) should hopefully remove these regressions. It is, however, yet another point of evidence that mixing two slightly different instrumentation runtimes will probably not be possible. - The Rust compiler uses the
jemallocallocator on Linux, using thetikv-jemallocatorcrate. We have been also experimenting with other memory allocators, but so far without a big success. Themimallocallocator looked promising, and it actually produces very nice speedups, around 4% instruction count improvements across the board! However, it sadly also increases the memory usage footprint of the compiler by up to 30%, which has been deemed unacceptable for now.
Final timings
To conclude this section, here is a final timing table for a recent try build:
-----------------------------------------------------------------
Stage 1 (Rustc PGO):                            1352.40s (33.12%)
  Build PGO instrumented rustc and LLVM:         559.03s (13.69%)
    LLVM:                                         74.81s ( 1.83%)
    Rustc:                                       479.09s (11.73%)
  Gather profiles:                               485.10s (11.88%)
  Build PGO optimized rustc:                     308.27s ( 7.55%)
    LLVM:                                          0.00s ( 0.00%)
    Rustc:                                       307.69s ( 7.54%)
Stage 2 (LLVM PGO):                              731.48s (17.92%)
  Build PGO instrumented LLVM:                   451.78s (11.07%)
    LLVM:                                        437.35s (10.71%)
  Gather profiles:                               278.71s ( 6.83%)
Stage 3 (LLVM BOLT):                            1652.75s (40.48%)
  Build PGO optimized LLVM:                     1172.76s (28.72%)
    LLVM:                                       1158.25s (28.37%)
  Gather profiles:                               372.88s ( 9.13%)
Stage 4 (final build):                           346.27s ( 8.48%)
  LLVM:                                            0.00s ( 0.00%)
  Rustc:                                           0.01s ( 0.00%)

Total duration:                                          1h 8m 2s
-----------------------------------------------------------------
The time to perform a try build went down from 2.5 hours to just barely above one hour. Not bad!
Now we perform 3 LLVM builds (normal, PGO instrumented, PGO optimized), and one of those is super fast
(just barely above one minute) and just two rustc builds. Much better than before!
Optimizing Rust’s continuous integration workflows
I have spent a lot of energy optimizing try builds, but that is just one of many workflows executed
in Rust’s CI (although a pretty important one). A few weeks ago, Pietro Albini (the head of the
infra team) has posted an
intriguing message
to Zulip, where he described the status of Rust’s CI. Turns out that we were running over 60 CI jobs
for every merge into the main branch, which in total took almost 400 hours of CPU time! Since this
message was stated basically as an optimization challenge opportunity, I took the liberty of taking
a look at our CI usage to understand “what takes so long” and how/if we could optimize it.
Analyzing CI usage
When you’re trying to optimize something, the first step should always be to measure and analyze its
current behavior. So as a first step, I put together a bunch of Python scripts
to help me analyze what’s going on in Rust CI workflows. These scripts have been invaluable to me
for understanding how could we improve the duration of the CI workflows. I’d like to thank
sladyn98, a new rustc contributor who has helped me with implementing
these analytical scripts!
I will show some of the outputs (charts) from these scripts in the rest of the post.
As an example, below you can find a historical chart of the duration of the dist-x86_64-linux job,
which builds distribution archives using the PGO script for Linux users. It is also the job which is
executed for try builds.
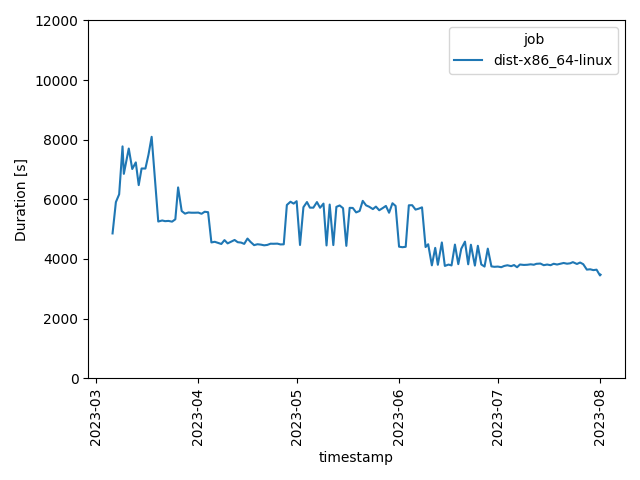
It’s clear that my efforts described in the first section of this post had some (positive) effect on the duration of the job!
Merging CI jobs together
Note: I will talk about bootstrapping “stages” below. If you want to understand how does the Rust compiler bootstrapping process work, see here.
By analyzing charts with durations of various CI jobs, I noticed that there are some CI test pipelines that are split into two GitHub Actions jobs. This split was probably introduced because the pipeline was historically too slow, and it couldn’t finish within the CI job time limit. The first job was thus executing only a subset of the test suite, and the second job executed the rest.
Here is an example chart of the x86_64-msvc-1 and x86_64-msvc-2 jobs:
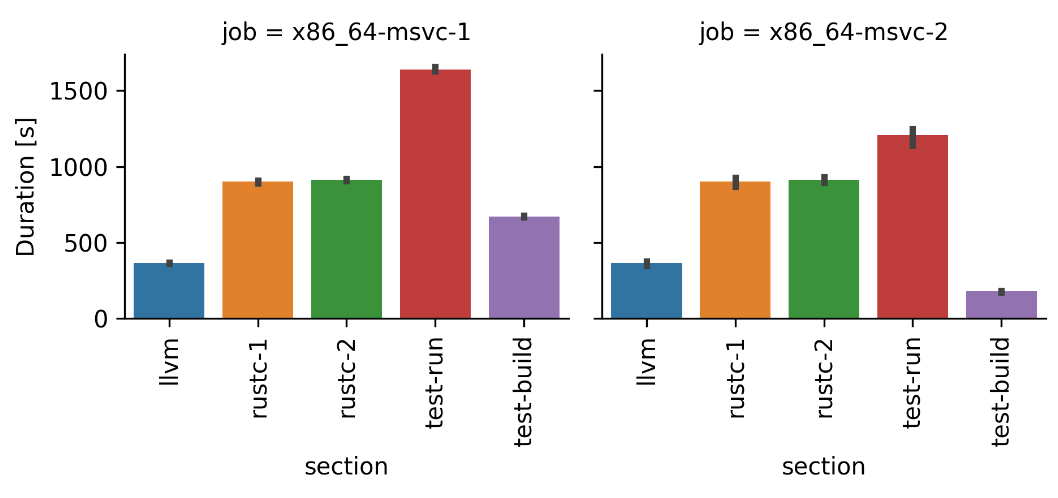
The columns contain durations of individual steps of the pipeline:
-
llvm: Time needed to build LLVM. -
rustc-1: Time needed to build the first stage of the compiler. -
rustc-2: Time needed to build the second state of the compiler. This stage is then tested. -
test-build: Time needed to build tests. -
test-run: Time needed to run tests.
If you take a look at the chart above, you might notice that there is a lot of wasted work. In both jobs, we build LLVM and both stages of the compiler (this is duplicated work!), and only then do we execute the tests. At the same time, both jobs took less than 2 hours, which is far under the GHA job time limit of 6 hours!
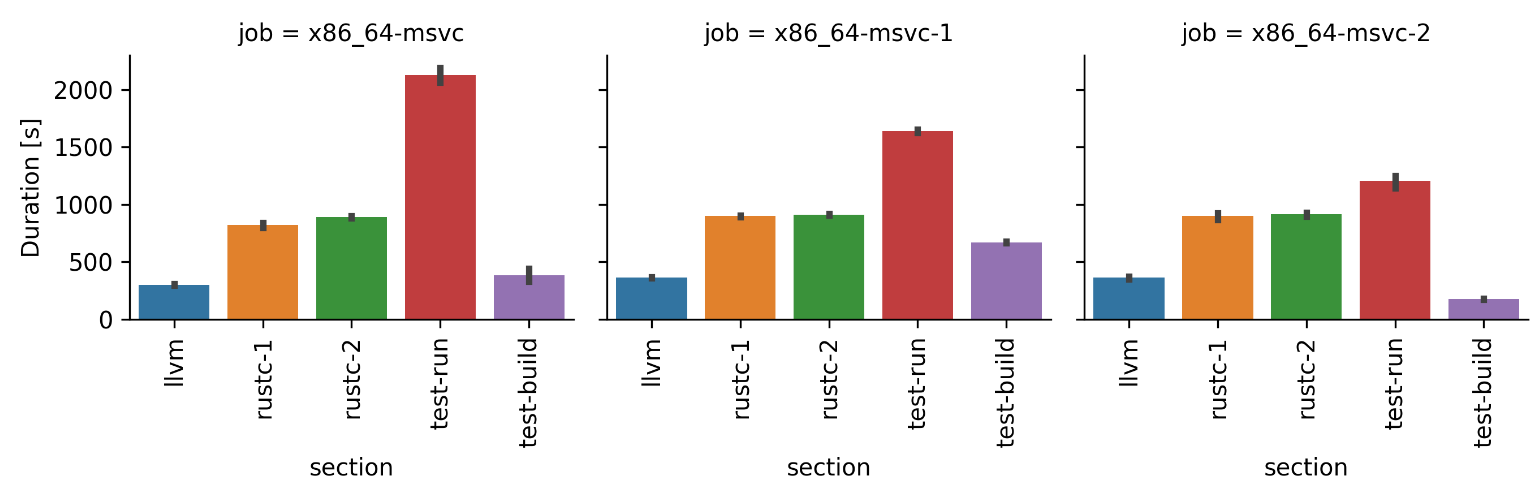
After realizing that it could be better to merge these jobs back into a single job, I tried to find other similar cases in the existing CI pipelines and eventually merged several of these together in #112633, #112645, #112796 and #112779.
For the x86_64-msvc CI pipeline shown above, its (combined) duration was reduced from ~7000s to
~4500s, and the other merged pipelines had similar results. Here is a chart of the combined job (x86_64-msvc),
together with the two previous split jobs, for comparison:
Avoiding unnecessary work
One of the benefits of having data from an analysis is that you can share it with others and then
let them do your job for you ![]() I have been regularly posting my findings and charts to the
I have been regularly posting my findings and charts to the
#infra
stream on Rust Zulip to discuss them with other contributors. After I have shared the following chart,
which shows the distribution of durations amongst different parts of the test suite of a particular
job:
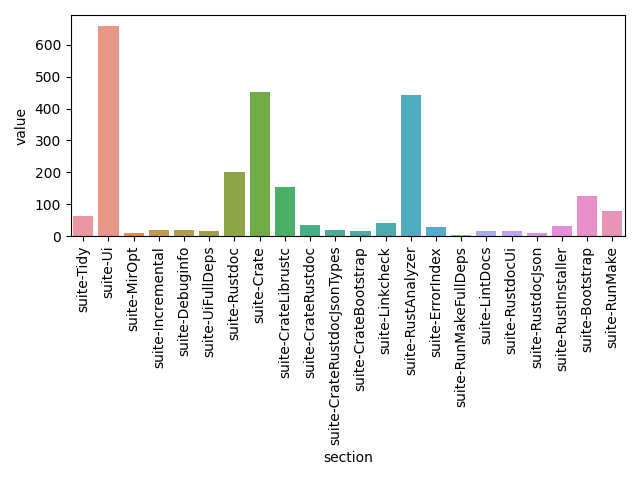
The8472 has noticed something peculiar. Why does it take almost 10 minutes to execute the Rust analyzer (RA) test suite, when we are actually running only a very small portion of it that is relevant for the compiler (the proc macro server part)? Well, it turns out that almost all of that time was spent on building the full Rust Analyzer project, which was completely useless, because the built IDE engine wasn’t used for anything.
After realizing this, I removed the build step of RA in #113244.
This one line change has reduced the total CI duration across all jobs for each commit by almost
2 hours! The effect was so large because RA was being built in a lot of jobs. Importantly, it has
also reduced the duration of the longest job (dist-x86_64-apple), more on that below.
Optimizing Apple pipelines
Apple pipelines have been historically the bottleneck of Rust’s CI. It was mostly caused by the fact that the macOS hardware provided on GitHub Actions just isn’t very powerful. The longest CI jobs were typically the Apple runners, which took about 3 hours to complete. They thus formed a bottleneck for Rust’s CI. Why is it important that one job is so slow? Because the slowest CI job determines how many merges4 we can do per day. So if the slowest job takes 3 hours, we won’t be able to do more than ~8 merges per day, even if all other CI jobs were super fast.
I tried to examine exactly what makes the macOS CI jobs so slow. One bottleneck mentioned by several macOS users was SIP (System Integrity Protection). It is some security service in macOS, which apparently makes process spawning (among other things) much slower. And guess what, the Rust test suite spawns a bazillion of processes :) It seems that for some users, disabling SIP resulted in the test suite being executed 5 times faster!
I tried to disable SIP on the GitHub Action runners, but (unsurprisingly) it was not possible because
of security reasons. The only other thing that came to my mind was… to rewrite the Rust
compiler driver and the test suite so that it doesn’t create so many processes ![]() So I started implementing
“rustc daemon”, a modified
So I started implementing
“rustc daemon”, a modified rustc binary that is able to receive compilation commands over TCP/IP,
and thus compile multiple crates (tests in this case) without spawning a new process for each compilation
session. It was an interesting exercise, and I was able to get it working on Linux, however it is still
a very hacky piece of code, and it would probably be nontrivial to get it working also on other platforms
(e.g. macOS). If anyone is interested, the code can be found here.
Luckily, before I had the chance to lose an inordinate amount of time on the daemon implementation,
the problem has mostly resolved itself in the meantime. In April this year, GitHub has
released new
GitHub runners that leverage macOS 13. These runners have two benefits - they run on more powerful
hardware, and they also apparently have SIP disabled. Therefore, just by switching
our Apple runners to macOS 13, the duration of the Apple jobs was massively reduced (almost by half in
one case!). We’re still not sure whether it was caused by the removal of SIP or by the more powerful
hardware, but as long as it’s faster, I’ll take it. A bit less exciting solution than my rustc compiler
daemon for sure, but a great improvement for a one line change nevertheless :)
After all the mentioned CI optimizations, we are now able to perform 12-13 merges per day in
the rust-lang/rust repository, as opposed to 7-8 merges that were possible before! While this is
good news for rustc contributors, it’s interesting to think about whether this has actually reduced
our usage of CI resources. It’s true that we now consume less CI resources per merge, but that also
means that we do more merges per day, and thus potentially consume more resources in total! Sometimes,
optimizing things in a grand scale can have unintuitive consequences. Thanks to faster CI and faster
try builds, we are now actually putting a lot of pressure on the performance benchmarking server
(because we send commits to it for benchmarking more often), and it struggles to keep up ![]() But that’s a story for another time.
But that’s a story for another time.
Improving the Rust benchmark suite
Most of my work on the Rust benchmark suite was actually spent on runtime benchmarks, which I will describe in a dedicated blog post, so here I will just quickly go through a few other recent improvements done in the suite.
Making it easier to share benchmark results (#1484)
When we perf. test a PR or a merge commit, people then usually go to the compare page to see the “performance diff” between two versions of the compiler. There are various filters and UI elements that you can modify to e.g. change a subset of benchmarks that you want to compare.
This PR modified the page so that most UI changes (like ticking a checkbox or modifying an input field) are reflected in the URL. This means that you can modify some filters, copy the URL, send it to someone else, and they will see the same thing as you, which is quite useful. It’s basically a sort of “permalink” functionality.
Improving visibility of doc benchmarks (#1531, #1533)
We are usually most concerned about the performance of check, debug and opt builds, and sometimes
gloss over the performance of doc builds, which measure how long does it take to document a crate.
In these two PRs, I tried to make their performance trend a bit more globally visible, by including
them in the graph overview and also in the
dashboard.
Expose more benchmark info in the compare page (#1626)
Compiler contributors that deal with its performance usually spend a lot of time looking at the already mentioned compare page. Sometimes, the performance results are quite surprising. This can happen for multiple reasons (most often because of codegen or measurement noise), and one of these is not enough information about the benchmark that we are looking at.
For example, the size:linked-artifact
metric is labelled as Binary size, and sometimes people were wondering why did a PR that shouldn’t
affect that size at all produce many changes in this metric. The answer lies in the type of the
benchmark - this metric actually only makes sense for binaries, not libraries5! Another case could be
an opt benchmark that has regressed by a change in debuginfo generation. Which sounds suspicious at
first, until you realize that said benchmark was compiled with
[profile.release]
debug = 1
:)
This PR thus propagates some important contents of Cargo.toml, along with information about the artifact
being built (whether it is a library or a binary) directly to the compare page. It is now displayed
directly when you hover on a benchmark:
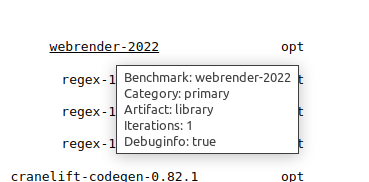
Apart from other things, it also shows iterations, i.e. how many times was the benchmark measured.
By default, we run each benchmark three times, but some benchmarks that are slow to compile (such as
cargo or webrender-2022) are benchmarked fewer times.
For displaying data on the site and for calculating historical variance, we always use the lowest measured value out of all performed iterations.
Performance run completion time estimation (#1654)
When you ask for a performance run on a PR using the @bors try @rust-timer queue command, the bors
bot first builds an optimized compiler out of your PR, and once that’s done, it schedules that compiler
build into the performance benchmark queue. After the build
is scheduled, the bot posts a rather cryptic message to the PR:
Queued 2a203d5 with parent 658fad6, future [comparison URL](<link to compare page>)
The link wouldn’t really work until the benchmark run has finished (hence the term “future URL”), and there was no mention of the status page that shows the progress of the queue. Therefore, if people didn’t know about the queue, they wouldn’t really know what to expect.
This PR modified the PR comment to provide more context:
- It now includes a link to the queue.
- It states how many other builds are in the queue before the current PR.
- It tries to estimate how long it will take until the perf. run finishes. We don’t know the upper
bound, because newer PRs might jump ahead in the queue before the current PR, the perf. server
might crash, etc., but we are able to estimate the lower bound quite precisely. In other words, we know
that the result will probably not be available sooner than in
Xhours.
This is how the comment looks now:
Queued 846ecf6 with parent 866710c, future [comparison URL](<link to compare page>).
There are currently 5 other artifacts in the [queue](<link to queue>).
It will probably take at least ~6.8 hours until the benchmark run finishes.
As you can probably infer from this comment, the duration of a single perf. run currently takes a little over one hour.
Tracking compiler artifact size (#1657, #1658)
We have been tracking the binary size of compiled benchmarks since last year,
which is quite useful to find out if some compiler change inadvertedly increases the size of Rust binaries.
However, we weren’t tracking the size of the compiler itself! This would be quite useful for example
to realize that BOLTing LLVM has increased its size by 50%, as mentioned sooner in the post ![]() .
.
These two PRs have added compiler artifact tracking. Sizes of important files that are distributed to
users e.g. via rustup, like librustc_driver.so (the main library of the compiler), libLLVM.so
(the LLVM shared library) or libstd.so (the standard library) are now stored into the database for
each benchmarked compiler version, and their diff is also shown on the compare page. While
this metric probably won’t be that relevant for most PRs that modify the compiler, it should help us
catch large regressions that might come from large updates, e.g. when we bump the used LLVM version.
Conclusion
And that’s pretty much all that I wanted to talk about. In the past few months, I was able to optimize
various parts of Rust’s CI, and also improve our monitoring of Rust performance. My work was also
rewarded by an invitation to the Rust infra team
![]() , which makes me quite happy :)
, which makes me quite happy :)
In a follow-up post, I will describe my work on the recently introduced runtime benchmarks. If you have any comments or questions, let me know on Reddit.
-
bootstrapeven has acopyfunction that internally uses hard links instead of copying This has tripped me up several times. ↩ -
SSE2 was supported even by Intel Pentium 4 or AMD Athlon 64, if these names mean anything to you
Although rustcprobably wouldn’t work on these for other reasons. ↩ -
Note the term merges instead of PRs. We often perform so-called “rollups”, where several PRs are merged at once, to save CI time. ↩
-
For libraries, this metric measures the size of
.rlibfiles, which include metadata, which is another thing entirely from “binary size”. Metadata size changes are quite common, which is causing the confusion regarding binary size changes. ↩