Exploring the Rust compiler benchmark suite
In my recent post about the Rust compiler CI
(continuous integration) and benchmarking infrastructure, I have promised to write a blog post about
runtime benchmarks, which is a new addition to the benchmark suite of the Rust compiler. However, I
realized that before doing that, it might be a good idea to first describe how does the benchmark suite
actually work, what are its components and how is it used by the Rust compiler (rustc) developers,
to introduce the necessary context. So, runtime benchmarks will have to wait ![]() , and instead
this post will try to introduce the current state of the Rust compiler benchmarking infrastructure.
, and instead
this post will try to introduce the current state of the Rust compiler benchmarking infrastructure.
I will attempt to describe the general concepts and the workflow used by rustc compiler developers
to measure and monitor the performance of the Rust compiler over time. The main focus will be on the
rustc-perf repository, which contains all the
infrastructure for Rust compiler benchmarks, and the so-called perf.RLO
website, which hosts various dashboards, charts and comparisons that
we use daily to analyze the compiler’s performance.
Note that while I am a member of the
wg-compiler-performanceworking group and theinfrateam (both of which are heavily involved in managing the performance ofrustc), any subjective claims that you might find in this blog post are mine and do not necessarily represent the views of the mentioned teams.
Problem statement
To really start from the beginning, we should first explain the motivation that led to the creation
of the benchmark suite. One of the most common complaints about Rust is that Rust programs are
slow
to
compile. I won’t go into the reasons
why that is the case here (short version: cargo compiles the “whole world” from scratch and Rust
made several design decisions that favor runtime speed instead of compilation speed), but even though
I have some opinions on the definition of “being slow” (more on that below), the fact remains that
many Rust developers consider the compiler to be slow enough so that it represents a very real
bottleneck to their development workflow, which is a big issue that we cannot afford to ignore.
This issue has been known for a long time of course, and therefore a lot of effort has been (and still is being!) expended to improve the performance of the compiler. More than five years ago, an official working group called wg-compiler-performance was established. The goal of this group is to continuously measure, monitor and improve the compilation times of Rust crates, primarily by optimizing the compiler, by sometimes also e.g. by contributing changes to popular Rust crates to make them faster to compile.
The thing that we are most interested in is how is the performance of rustc changing over time,
and in particular, how do individual changes (pull requests) to the compiler affect its performance.
We track these compilation performance changes using the rustc-perf infrastructure, which I will
describe in detail in this post, and look out for possible major regressions. However, this does not mean
that we ban all pull requests (PRs) that cause compilation time regressions! Sometimes, it is necessary
to accept such PRs, for example to fix a soundness hole in the compiler, or to make some
part of the compiler simpler and more maintainable for the future. We have to remember that while it
is very important, performance is not everything, and always has to be judged against other metrics1!
Continuously monitoring the performance of a compiler or a library is not a new idea of course, and
there are several other projects that employ this technique, such as
numpy, CPython,
PyPy or LLVM. The general idea is to measure the performance of X on a defined
set of benchmarks continuously (e.g. after each commit), display the history of performance changes
in an intuitive way and ideally also immediately alert the developers when regressions appear.
Aside: is the Rust compiler slow?
Probably… but compared to what?. To properly answer such a question, we must have some sort of baseline.
Nothing is ever slow on its own, it is always slow compared to something else. So, compared to a
language like Python, rustc is definitely a lot slower, because a Python program doesn’t really
require a separate compilation step2 and starts executing pretty much instantly. Of course,
in the case of Python, you will probably pay for this by having reduced runtime performance and a
higher chance of runtime errors, but that is another set of trade-offs that is not strictly related
to compilation performance.
Now, compared to a language like C++, which has much more similar runtime performance characteristics to Rust, I think that the story is less clear-cut. I won’t be doing any large-scale scientific measurements here, or trying to pick a winner, but I consider it to be interesting to think about the differences in design between these two languages, like:
- In C++, by default, a translation unit is a single source file, while in Rust it is a whole crate. So after performing a single change, you either recompile a single file3 (C++) or a whole crate (Rust). Of course, incremental compilation can help speed this up dramatically, but it is still an important difference.
-
When you compile a Rust project, it will typically compile all its dependencies from scratch, except for the Rust and C standard libraries (and “native”, usually C or C++, dependencies).
As a totally random and meaningless example, if I run
cargo install ripgrep --features pcre2, it compilesripgrepand all its ~70 dependencies (with optimizations) in ~17 seconds on my machine. If I compileugrep, aripgrepcompetitor written in C++, it takes ~10 seconds. But that is just the compilation ofugrepitself! It didn’t compilelibbz2,liblz4,liblzma5,libpcre2,libzstd1norzlib1g, all of which areugrep’s dependencies and which were already precompiled on my system. These numbers are not really meaningful4, but I consider it interesting to think about the amount of work the compiler is doing, in relation to its perceived speed. The benefit of the additional work thatrustcis doing here (compiling everything from scratch) is of course thatripgrepcan use dependencies from a central registry in a very easy way, which is notoriously not the case for C++. - The Rust compiler is doing a lot of checking that most other mainstream languages don’t perform, like borrow checking or trait resolving. Not to mention its (commonly praised!) diagnostics, which provide a lot of value to Rust developers, but that also cause some performance penalty.
One thing that I like to think about in this area is throughput (how much lines of code can you compile
per second) vs latency (how long do you have to wait after performing a single code change). I think
that rustc is not that bad in terms of throughput. As shown above, you can compile a nontrivial
program (ripgrep) along with tens of dependencies, in under 20 seconds in release mode.
Even in CI scenarios, where full rebuilds are common, you can usually compile your crates in a reasonable
time using tools like rust-cache or cargo-chef.
What I consider to be the biggest pain point of rustc’s performance, which you probably notice
immediately while using rustc, is the latency. It might not seem like a big deal to wait for a
few seconds until your program or tests are built or type-checked after performing a small change,
but this adds up quickly. For me personally, improving the latency of the compiler would really help
speed up my local development workflow considerably.
I guess that the point that I’m trying to make is this: for the amount of work the Rust compiler is
doing (compiling heavily optimized binaries using monomorphization, while providing an enormous set
of compile-time checks), I would argue that it is actually quite fast. Of course, this doesn’t really
help Rust developers that have to stare at the terminal for X seconds or even minutes after running
cargo build or cargo check :) So we still have a lot of work to do. But enough of this mini-rant,
let’s get back to measuring the performance of rustc.
What do we want to measure?
To measure something, we first need to decide what do we want to measure. “Performance of
rustc” is a very broad term, after all. There are actually several things that rustc-perf
analyzes for a given artifact (a specific version/commit/build of rustc):
- Compilation performance How much resources (time, memory, …) does the artifact consume when compiling Rust crates? Or, in simpler terms: how fast does it compile Rust code? This is probably the most interesting statistic for Rust developers, and it will be the main focus of this post.
-
Bootstrap time How long does it take for this artifact to compile itself (its own source code)?
Since
rustcis composed of a set of Rust crates, this can be seen as a subset of compilation performance. Nevertheless, it is interesting to monitor it separately, because it is also affected by source code changes that don’t necessarily affect the performance of the compiler, but that do affect the time required to compile it (like extracting, merging or removingrustc_*crates within the compiler workspace). This measure is of course also very important forrustcdevelopers, because it directly affects their iteration speed when working on the compiler. - Runtime performance How fast/efficient are Rust programs compiled by this artifact? This part is relatively new, and I will dedicate a whole blog post to it (Coming soon™).
-
Artifact size How large are the individual components (libraries, binaries) of the artifact?
This is sometimes important for performance, but mainly it affects things like the size of toolchain
archives distributed by
rustup.
As a sneak peek, here you can see one specific comparison of these four statistics between two artifacts (two different compiler versions). Note that in the rest of the post, I will primarily focus on compilation performance.
Benchmarks
To measure the performance of the compiler, we need some benchmarks. In our case, each compile-time
benchmark is a single Rust workspace (i.e. either a single crate or multiple crates). When we perform
a performance analysis, we compile each benchmark with the analysed rustc artifact several times,
and measure various metrics that are interesting to us (I’ll talk more about metrics and the
benchmarking process later in the post).
Currently, we have about fifty benchmarks, which form the compile-time benchmark suite. They are divided into three categories:
-
Primary These are the benchmarks on which we focus the most, because they represent real-world
Rust code that will be typically encountered by most Rust developers. These include crates like
hyper,ripgrep,regex,syn,serde,diesel,cargoorclap. -
Secondary These benchmarks contain more arcane and unusual Rust code, which stresses
rustcin various ways. They might not necessarily represent real-world code, but they are still useful to detect issues like memory exhaustion, stack overflow or catastrophically long compilation times (caused e.g. by some accidentally quadratic behavior) that sometimes happen in edge cases. For example, there are benchmarks that contain deeply nested types, very large arrays or huge match expression. Even though you will probably not encounter such code in the wild (although, sometimes a bit of liberal macro usage can produce similar horrors), these stress tests can sometimes tell us when some part of the compiler suddenly becomes much slower.There are also two secondary benchmarks (
helloworld-tinyandripgrep-13.0.0-tiny), which exist solely to monitor the size of a “minimal-sized” Rust executable, which is compiled with compiler flags that should favour small executable size. -
Stable This is a special category of benchmarks which are not used for “day-to-day” performance
comparisons, but rather for monitoring the long term trend of
rustccompilation performance. We are running these benchmarks for every released stable and beta version ofrustc, going all the way back to1.28.0. You can see the historical trend of these benchmarks in the dashboard. These benchmarks are called stable, because we try not to modify them in any way5, so that we have a historical baseline for comparing amongst different stable versions ofrustcover a long time period. This is in contrast to the primary and secondary benchmarks, which are being rotated or updated from time to time, according to the benchmark update policy.
It is not always easy to decide if a benchmark should be included in the benchmark suite or not. We try to keep a healthy mix of real-world benchmarks and stress tests, and also attempt not to have too much overlap, as it’s not very useful to have two secondary benchmarks that both stress e.g. trait resolving in the same way.
We also want to keep the scope of the suite somewhat reasonable. You could ask why don’t we e.g. benchmark the most popular 1000 crates from crates.io or something like that. Well, performing so many benchmarks would cause (at least) two problems:
- It would take a long time to execute the benchmarks. Currently, it already takes more than an hour
to run the full benchmark suite. Increasing this time increases the latency of finding out if a
PR/commit caused a perf. improvement or a regression, which can be a bottleneck for
rustcdevelopers. The benchmarks are currently executed on a single machine, and we’re already hitting the limits of its benchmarking throughput. - Having so much data would make it harder to make sense of the results. We frequently encounter
noise in the benchmark results, and the more benchmarks we would have, the bigger the danger of
false noisy signals creeping in would be. Furthermore, it would make it harder for us to understand
why has a perf. change happened. With our current suite, whose size is (in my opinion) relatively
reasonable,
rustcdevelopers that focus on the performance of the compiler are somewhat familiar with the benchmarks, to the point that they can often guess what could have caused a regression just by eyeballing the set of benchmarks that have been regressed. It would be much harder to build and exercise this knowledge if we had e.g. a thousand benchmarks.
If you want to examine the existing benchmarks in more detail, you can find the list of the currently used compile-time benchmarks along with their descriptions here.
Benchmark configurations
There are various workflows and corresponding expectations arising when compiling Rust code. Some
Rust developers care only about the performance of type checking (cargo check), e.g. to provide
quick feedback in their IDE. Some developers want really fast incremental debug builds, e.g. to
repeatedly re-run tests after making small changes to the code. And others want to have really fast
optimized builds, because the runtime performance of non-optimized builds is not good enough for them,
e.g. if they are developing games.
That is why we have two configurations that affect how is a benchmark compiled:
-
Profile Defines the used Cargo command.
-
debug: Corresponds tocargo build, uses thedevCargo profile. -
opt: Corresponds tocargo build --release, uses thereleaseCargo profile. -
check: Corresponds tocargo check. Performs only type checking without code generation. -
doc: Corresponds tocargo doc. Builds the documentation of the crate.
-
-
Scenario Defines a compilation workflow.
-
full: Performs a non-incremental build, akin to settingCARGO_INCREMENTAL=0(this is normally the default forreleasebuilds). -
incr-full: Performs an incremental build, akin to settingCARGO_INCREMENTAL=1(this is normally the default fordevbuilds). -
incr-patched: Performs a rebuild of a crate compiled with an incremental build, after performing some change to its source code. Each benchmark can define severalincr-patchedscenarios, corresponding to different changes being made (e.g. adding a comment, adding aprintln!call, removing a statement, etc.). -
incr-unchanged: Performs a rebuild of a crate compiled with an incremental build, after no changes have been made to its source code. This scenario is not very practical in normal compiler usage, but it serves as a baseline for how fast can an incremental build be, if it doesn’t actually need to perform any changes.
-
Unless a benchmark explicitly opts out of some profile or scenario, each benchmark is executed with
the cartesian product of all profiles and scenarios (except for the doc profile, which is executed
only once with the full scenario). In other words, we run each benchmark with many configuration
combinations (profile=check + scenario=full, profile=opt + scenario=incr-full,
profile=debug + scenario=incr-unchanged, etc.).
If I’m counting correctly, most benchmarks will be thus executed with ~13 configurations (some of them
may opt out of some configurations, or they can define more than one incr-patched scenario).
Furthermore, we execute each configuration three times (unless the benchmark reduces the number of
iterations to reduce benchmarking time). This means that most benchmarks are being compiled almost
fifty times during each performance analysis! For some of the larger benchmarks (e.g. cargo), it
takes several minutes until all the configurations are measured (and cargo is actually one of the
benchmarks that only performs a single iteration).
One important thing to note is that we only measure the performance of compiling the “leaf” (workspace)
crates. For example, the ripgrep crate has tens of dependencies. In our suite, we don’t measure
the compilation of all these dependencies, we only measure the compilation of the final binary
crate/target. This makes the measurement more stable (and faster), but it also means that we can’t
make a lot of conclusions about the end-to-end compilation performance of Cargo compiling large crate
graphs. Another approach or a different performance suite would be needed for that.
If you want to learn more about the benchmark configurations and other terms that we use when
talking about rustc benchmarks, you can find more information in the
glossary.
Metrics
Now that we know what we want to measure (resources consumed by rustc when it compiles a Rust crate)
and we have seen how do our benchmarks look like, we should define what are the kinds of “resources”
that are interesting to us. There are actually many metrics that we gather when we benchmark an
artifact, you can find their list
here.
Some metrics are gathered by running rustc under the perf profiler, some come from the compiler’s
built-in self-profiling mechanism
and some are measured externally (e.g. looking up the filesize of the built Rust executable on disk).
Below is a summary of the most important metrics that we take into account when compiling a
benchmark using a rustc artifact:
- Instruction count (
instructions:u)6: How many instructions were executed? - Cycle count (
cycles:u): How many CPU cycles were executed? - Wall-time (
wall-time): How long it took to compile the benchmark? - Maximum memory consumption (
max-rss): What was the highest amount of RSS (Resident Set Size) of therustcprocess? In other words, what was the maximum amount of RAM occupied byrustcat any given moment during compilation? - Binary size (
size:linked-artifact): What is the size of the compiled executable (for binaries) or the.rlibfile (for libraries)? This metric is a bit tricky, because for libraries it doesn’t really mean “binary size” in the classical sense (because they are not binaries, duh), and this sometimes confuses contributors. For libraries, this metric also included size changes ofmetadata, the Rust-specific data used to exchange information between crates when compiling a crate graph.
There are other metrics, like page faults, cache misses, branch mispredictions, etc., but these are usually too low-level or too noisy for us to take into account, unless we analyse a specific compiler change that is targeted to improve one of these metrics.
You might wonder why I only put wall-time as the third metric in the list above. Shouldn’t it be
the most important metric? Indeed, the actual compilation time is the thing that we want to improve
the most, because it most affects the everyday workflow of Rust developers. However, it is also
a very noisy metric, and it is notoriously difficult to use it for comparing the relative performance
of two programs (artifacts). The compiler is a very large program7, and a single
change/commit/PR will usually not have an enormous effect on its performance. However, we still want
to be able to detect even relatively small performance changes, to avoid a death by a thousand cuts.
If we used wall time for such detections, we would be drowned in noise, unable to recognize small
performance perturbations.
Therefore, we instead primarily usually use instruction count as the primary metric, because
it is quite stable (=resistant to measurement noise) and thus allows us to detect even relatively
small performance changes. It is also usually relatively highly correlated with wall time, which is
the ultimate metric for our needs. Sometimes we also take max-rss, cycles, binary size or other
metrics into account, if needed.
How is the benchmark suite executed?
Now that we know about both the benchmarks and the metrics, it is time to talk about how do we actually
execute the benchmarks. It is done using the collector binary, which is
implemented in the rustc-perf
repository. It contains various commands for executing the compile-time benchmark suite, but also for
profiling rustc on a specific benchmark to learn more about its behavior. It can profile the compiler
with various profiling tools, such as Callgrind,
Cachegrind, dhat
or perf.
rustc developers can run the benchmarks locally with a custom build of the compiler, which can be used
to quickly judge the performance effect of local compiler modifications. However, such locally gathered
results might not always correspond to the actual performance profile of the compiler, because locally
built rustc versions usually do not contain the
complex
optimizations that we perform on CI. Therefore,
benchmarks are usually performed on our custom benchmarking infrastructure.
The benchmarks are executed on a dedicated machine (which I will call collector server), whose
location is top secret8. Its hardware parameters and software configuration can be found
here.
The machine is set up in a way that tries to minimize environment noise. It has disabled Hyper-threading,
frequency scaling and ASLR (Address Space Layout Randomization), and uses a few other configuration
options in an effort to keep the measurement results as stable as possible. We could perhaps still
go a bit further in tightening down the machine, but I feel like we’re hitting diminishing returns
already, and I don’t think that we could ever get to a point where we’d have so little noise that
e.g. the wall-time metric could be reliably used to detect small performance changes anyway.
Performance measurement workflow
Ok, so now we know how and where are the benchmarks executed, but how it all fits together? How does the collector server know when and what to benchmark and how do the benchmark results find their way into the perf.RLO website? I’ll try to explain it, but first, I want to describe a few terms:
- Benchmark database (DB) Postgres SQL database that stores the results of all benchmarks that we execute, plus additional metadata needed to support our monitoring and benchmarking workflows. If you’re interested, the schema of the database can be found here.
- Collector server The dedicated machine that actually runs the benchmarks. It communicates with the perf.RLO site and stores results into the benchmark database.
-
perf.RLO Web service that facilitates communication of the perfbot, the collector server and
the benchmark DB. It also hosts a website with various dashboards
that are used by
rustcdevelopers to analyse the performance of the compiler. - Perfbot GitHub bot that receives benchmarking commands from users and posts comments on pull requests. It is deployed as a part of the perf.RLO server.
All of these components are implemented in the rustc-perf
repository.
Here is a diagram that shows the individual components and how do they communicate together:
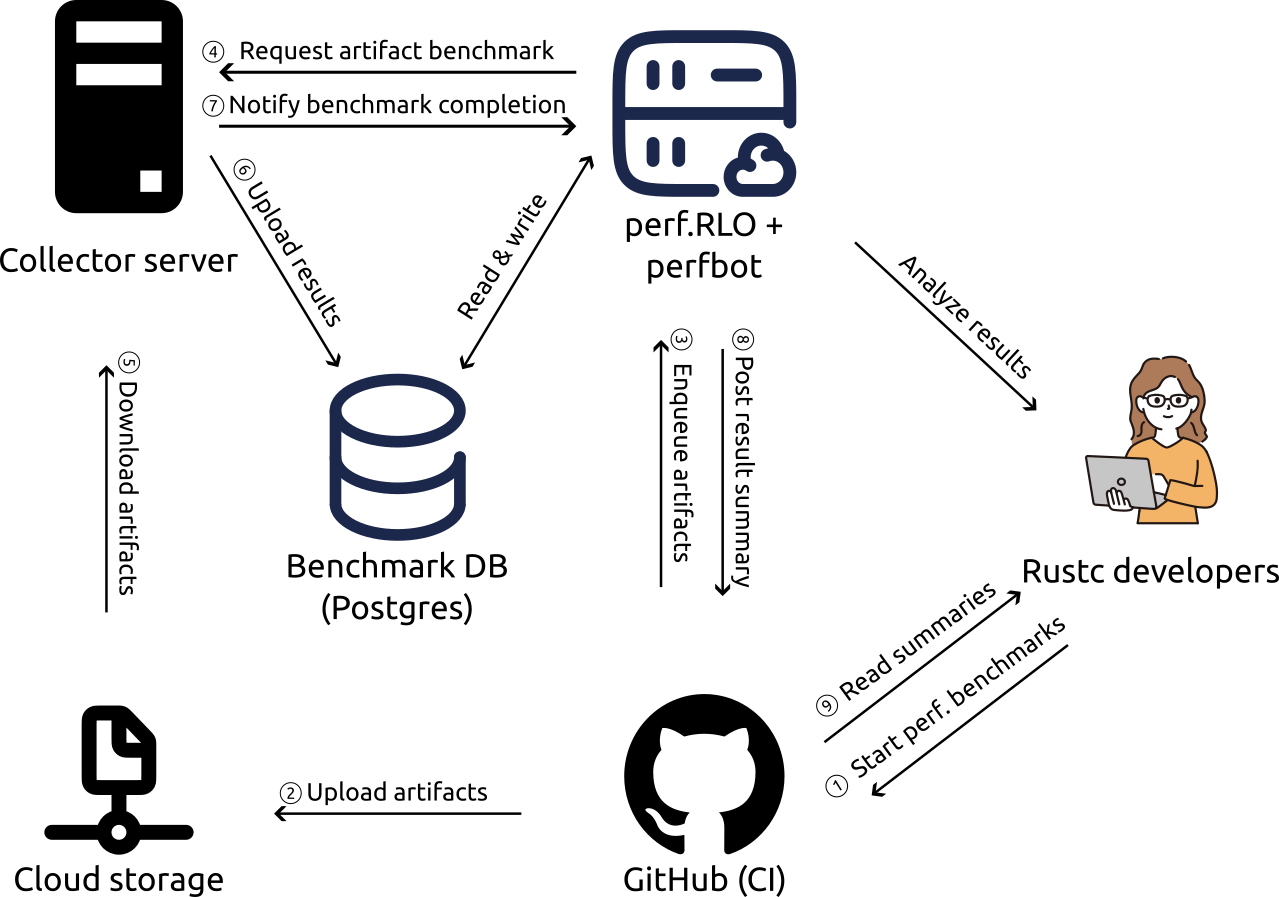
Icons for the diagram were sourced from svgrepo.com.
I included “sequence numbers” in the diagram to hint at what can be the approximate order of the
displayed events and actions. Below I’ll describe what is happening in more detail, by walking through
the whole workflow of benchmarking a single rustc artifact (a single benchmark collection):
-
Creating a
rustcartifact The first thing that has to happen when we want to measure the performance of some artifact (version of the compiler) is that the artifact must be created. This usually happens in one of two ways:- A pull request is merged into the
masterbranch ofrust-lang/rust. This launches a corresponding CI job, which compiles a heavily (PGO/BOLT/LTO-)optimized build ofrustc, which is then uploaded to a remote storage (S3 at the moment), and later downloaded by the collector server. After the recent optimizations, usually around 8-12 PRs are merged each day, and all of them have to be benchmarked. - We want to know if a specific pull request has any effect on the compiler’s performance, before it
is merged. In that case, we can instruct our merge-queue bot (
homu/bors) to prepare arustcartifact from the latest commit of the PR using a so-called try build. When a try build is performed, the PR is rebased onto the currentmastercommit and built with all the CI optimizations, as if it was a merged commit. This try build is then again uploaded to remote storage and later downloaded by the collector server. Try builds can be triggered by posting a comment containing@bors tryon a pull request (if your account has the appropriate permissions).
Each artifact has a default baseline (parent) artifact, against which it is compared by default. For
masterartifacts, it is the preceding (parent)mastercommit, and fortryartifacts it is themastercommit upon which its PR was rebased. We can of course select a different baseline for comparison in the perf.RLO UI manually, if we want to.Note that currently we only benchmark artifacts built for the
x86_64-unknown-linux-gnutarget, i.e. 64-bit Linux, which is probably the most common target used by Rust developers. We do not benchmark the performance ofrustcon other platforms and operating systems. - A pull request is merged into the
-
Queuing the artifact Once an archive with the compiled artifact is available for download, we need to add it to the benchmark queue. For
mastercommits, this happens automatically through unrelated Rust infrastructure that gets this data from GitHub. Fortrybuilds, users have to manually enqueue the build using the@rust-timer queuecommand posted in a comment on the pull request of the try build.Queuing the artifact means storing it into the benchmark database. Once it is there, it will appear in the status page, which shows both the current queue and the artifact that is currently being benchmarked. There is a certain ordering of the queue, which is usually not that interesting. What is important is that we first benchmark the baseline/parent artifact of artifact
Xbefore benchmarkingXitself, otherwise we won’t have anything to compare against.I think that the status page is a bit confusing at the moment, and misses some useful information, so I’m planning to redesign it soon.
-
Running the benchmark The collector server basically runs an endless loop, in which it queries the perf.RLO service, asking for the next artifact that it should benchmark. Once it receives a response, it downloads the artifact archive (containing
rustc,cargo, the standard library, LLVM and all other toolchain components), extracts it and uses it to run the whole benchmark suite. It continuously stores data into the database during the benchmark execution, so that the benchmark progress can be observed on the status page, which reads the data from the DB. It also records any possible compilation errors that sometimes happens e.g. when a PR breaks some functionality ofrustc. After the benchmark collection is finished, it notifies perf.RLO that it has finished, and starts asking for the next artifact to be benchmarked. -
Posting the performance summary
Once the benchmark collection has completed, the perfbot will perform an analysis of the performance
results, and create a short summary that compresses the most useful results into a few tables, which
are then posted as a comment
to the pull request associated with the artifact. If the analysis heuristics consider the change to
be a regression, it will mark the pull request with the
perf-regressionlabel, and it will hint to the PR author that they might want to take a look at the performance results and potentially try to do something about them. It will also ping thewg-compiler-performancegroup. Someone from the group will then usually chime in, and either cooperate with the PR author to resolve the regression, or consider the regression to be noise or to be acceptable and addperf-regression-triagedlabel to the pull request, marking the regression as triaged. -
Analysing results in perf.RLO The posted summary comment contains several links pointing to the perf.RLO website, which contains many useful views for examining the performance of
rustc. Probably the most commonly used page is the comparison page. It contains comparisons of results of the individual benchmarks between the benchmarked artifact and its baseline/parent artifact. This data can be filtered and further analysed with various summaries.The individual benchmark results also contain links to a
detailed query page, which contains very detailed information about the benchmark execution, recorded by the compiler’s self-profile machinery. While this information will probably only be grokkable by expertrustcdevelopers, it is sometimes an invaluable tool to understand what exactly has caused the performance perturbation. The page also contains example commands which can be executed locally to display a difference betweenCachegrindprofiles of the two artifacts, which can be further used to analyse the performance changes.
And that’s (mostly) it. This workflow is repeated several times each day, and serves as an invaluable tool to help us monitor the performance of our beloved compiler.
Decision policy
Apart from the technical details of how are the benchmarks executed, one important aspect of the benchmarking process is also the decision-making policy which deals with performance regressions. The performance aspect of (new) code in the compiler is quite important to us. If we find out that a PR causes too large regressions before it is merged, it might be a reason to hold off the PR temporarily, until we can find a way to reduce the regressions. Sometimes, regressions can even be the reason why a PR is abandoned completely! If we only find out about the regression after the PR has been merged, we can decide to either revert the PR completely, or ask its author (or someone else) to try to send a PR that will hopefully resolve the performance issue.
Now, the question of course becomes: What is a “too large regression” and how do we recognize it?
I’m afraid that I don’t have a perfect answer for that ![]() . Our infrastructure is quite
good at alerting us when something regarding performance changes, but then we still have to do
(at least) two more steps:
. Our infrastructure is quite
good at alerting us when something regarding performance changes, but then we still have to do
(at least) two more steps:
- Decide if the change is noise or not. I’ll talk more about noise below.
- If we consider the change to be real (i.e. not just noise), decide if a regression is acceptable
or not.
Note that we generally consider all improvements to be acceptable
 Although sometimes
it can still be valuable to examine why exactly has something been improved (when it wasn’t
expected).
Although sometimes
it can still be valuable to examine why exactly has something been improved (when it wasn’t
expected).
These two steps are fairly manual, and unless the regressions are truly large, usually someone from
the wg-compiler-performance or compiler teams (or the PR author) decides on their own whether
the regression is acceptable or not, based on the pull request contents. If the situation is more
complicated, more people usually chime in to the pull request and discuss the performance results
together.
Currently, the process is heavily based on judgement calls and experience – people that are familiar
with the compiler often have a pretty good guess if a change is noise or not, or if a regression is
“small enough” so as not to warrant any further investigation or resolution. Sadly, this experience
is hard to transfer to new rustc contributors, which is something that we should strive to improve.
Dealing with noise
One of the most limiting factors of introducing more automation into the decision-making process of regression handling is the ever-present noise, which requires us (humans) to make judgement calls. There are two main sources of noise that affect the results of compilation benchmarks:
-
Measurement noise This is probably the first thing that comes into mind when “noise” is mentioned.
Some background process might execute a few instructions on the collector server while a benchmark
is being measured, or a kernel interrupt or context switch arrives at an unfavorable time, or someone
opens the window in the room where the machine is located, thus affecting the room temperature and
in turn possibly also the CPU’s performance
 . This noise is what makes the
 wall-timemetric pretty much unusable for comparing small changes to the compiler. However, since we mostly focus on the instruction count metric, which is relatively immune to this kind of noise, it is not usually the main culprit. -
Codegen noise This one is perhaps a little less obvious, but it is actually quite devious.
Both
rustcand LLVM contain many heuristics that perform decisions like:- Should this function be inlined?
- Should this loop be unrolled?
- What instruction should this IR (Intermediate Representation) construct be lowered to?
These decisions can have a non-trivial effect on the runtime performance of the program being compiled, and they can also be quite “contagious” – deciding to inline a single function can result in a myriad of other compiler analyses, transformations and optimizations suddenly being performed.
Ok, but how does that concern us? Well,
rustcis a program that is compiled withrustc(and LLVM). Therefore, if some of its (performance critical) functions are near a threshold of some heuristic, seemingly innocent and unrelated changes to its source code can make these functions go over (or under) that threshold, and thus alter the performance ofrustcin a big way! You add an innocentprintln!line to onerustcfunction, and suddenly that function might not pass an inlining threshold and not get inlined, which can regress the compiler’s performance.What’s worse, if some part of the compiler is near such threshold, it’s possible that it will go back and forth and oscillate around the threshold. This situation is quite annoying, and frequently causes “noise blips”, where a benchmark suddenly regresses/improves out of nowhere, only to go back in the opposite direction a few commits later. Since these differences in codegen affect the amount of instructions executed by
rustc, not even the (normally quite stable) instruction count metric is immune to this effect.Even though this phenomenon can happen for pretty much any non-trivial program, there is an additional second order effect in play here, because the final build of the compiler is compiled using its own source code (a “stage-2 build”). Therefore,
rustcsource code changes can both directly affect its own codegen quality, and also the codegen decisions it makes when it compiles other Rust crates, both of which can have an effect on its compilation performance.
Encountering results that are (or look like) noise is sadly not uncommon. So what do we do when we’re not sure whether something is noise or not?
- Analyse the historical variance of the regressed metric/benchmark combination, using historical charts. This helps us notice if there were e.g. some suspicious “blips” in the recent history.
- Use the profiling machinery (usually
Cachegrind) offered by thecollectorto compare execution profiles between the two compared artifacts. These profile differences can often show us that a change in instruction counts is benign and was caused by an uninteresting codegen difference. - Ask @lqd . He always seems to know exactly when some source of
noise has started occurring, and in general has an incredible insight into what is currently going on
with
rustcPRs and their performance effects.
The perf.RLO site also has some built-in noise filtering that helps to combat noise. It uses simple statistical analysis based on historical data for a given metric/benchmark combination, which computes a significance threshold. The more variance is present in the historical data (=the more noisy benchmark is), the higher the threshold. If a change does not go above this threshold, it will be hidden by default in the artifact comparison page, and it also will not be shown in the PR comment with the performance measurement summary. This works relatively well, but even with the threshold, noisy results still crop up from time to time (mostly because of codegen noise).
Weekly triages
Apart from observing and reacting to the results of individual PR benchmark results, there is also
a periodical process called the “weekly triage”. There is a roster of rustc developers who take
turns analysing all PRs that modified the performance of the compiler over the last week and preparing
a “triage report” that summarizes the compiler performance changes over that week. They also go
through PRs that caused regressions and decide to either mark these regressions as unimportant or
expected, or to ask the PR author to examine how could the regression be reverted.
The creation of the triage report is partially automated by rustc-perf, which generates a template
for the report using data from the benchmark database and GitHub. This makes the process much easier
for the person doing the weekly triage.
The weekly triage is then presented at the Rust compiler team meetings on Zulip, and it can be also found in the This Week in Rust newsletter.
Future
Before concluding, I’d like to mention a few things that are in the works for our benchmarking infrastructure. I have already mentioned runtime benchmarks several times, which I will describe in a future blog post, but there are also some other things on the horizon:
- Parallel frontend The Rust compiler is currently only multithreaded when performing code generation using LLVM, otherwise it executes serially. There is an ongoing (and promising!) effort to parallelize also the “frontend” part of the compiler (parsing, macro expansion, type checking, type resolving, linting, etc.), which could provide further speed-ups. However, it might also require some rethinking of how we perform the benchmarks, e.g. by introducing some new configurations (like the number threads used for compiling) or by adding new profiling methods that would help us better analyze multithreaded performance.
-
Alternative codegen backends Another ongoing effort that promises to speed-up compilation (but also
perhaps modify/improve the runtime performance of Rust programs) is the development of different
“codegen backends” (other than LLVM). The most developed backends at the moment are the
CraneliftandGCCbackends. Once these backends can be used as a reasonable replacement for LLVM (and once they are integrated into our CI, so we can easily distribute them to end users and the collector server), we might want to introduce another configuration option for the benchmarks, which would allow us to test compilation performance using different codegen backends. - Multiple collector servers The current collector server sometimes struggles to keep up, especially since we now merge more PRs per day, and each benchmark collection is slower because of the newly added runtime benchmarks. We might eventually hit a point where we will need to distribute the benchmarking across multiple machines, which will further complicate the whole infrastructure and make us deal with things like managing noise and different hardware parameters across different machines.
Contributions are welcome!
Nothing that I have described in this blog post is set in stone! There are a lot of things that can
still be improved, modified or streamlined. Contributing to rustc-perf can be perhaps less intimidating
than jumping directly into the compiler, since it’s not such a massive piece of code, and it is relatively
self-contained.
It also contains contribution opportunities in many different areas! Sometimes we need to write
SQL queries, implement a
CLI command in Rust, improve our
statistical analysis algorithms, or modify a web
frontend written in Vue. There is something for
everyone, so if you would like to try to contribute to it, don’t hesitate to contact me, or ask around
in the t-compiler/performance
Zulip stream :)
Conclusion
There is a lot of other details and things that I have not mentioned or glossed over in this post
(and even then it’s quite long ![]() ), but I hope that I got the gist of our benchmarking
process across. I think that the way in which Rust developers monitor the performance of the compiler
is quite cool, and I’m happy that I have the opportunity to be a part of it, and to
contribute to making the process better.
), but I hope that I got the gist of our benchmarking
process across. I think that the way in which Rust developers monitor the performance of the compiler
is quite cool, and I’m happy that I have the opportunity to be a part of it, and to
contribute to making the process better.
If we want to keep making the compiler faster and faster, having (and maintaining!) infrastructure for monitoring its performance is a necessary component. And it seems to be paying off - since one year ago, the performance of the compiler has actually improved quite a lot!.
If you have any comments or questions about the rustc benchmarking suite, or want to join our benchmarking
efforts, let me know on Reddit.
-
We could probably make the compiler faster by rewriting half of it in assembly, but Rust developers probably wouldn’t be happy if it then took 10 years to implement a single new feature into the language :) ↩
-
Yes, I know, bytecode compilation and JIT and different interpreters… Let’s not get into the weeds :) ↩
-
Probably in addition to tens or hundreds of header files :) ↩
-
No, really. Please ignore these compilation time numbers and don’t make any conclusions out of them. This “benchmark” is surely apples vs oranges in many ways. I just wanted to demonstrate the difference between compiling everything from scratch and using precompiled dependencies that have to be provided via external means, which is not always that simple. ↩
-
Unless they stop compiling on the stable
rustcchannel, which does happen sometimes, for example when an unsoundness hole or some UB is fixed in the language. ↩ -
The
:usuffix comes fromperf, and specifies that instructions executed in the kernel are not included. ↩ -
Running
tokeion therust-lang/rustrepository tells me that the compiler itself has almost 600 000 lines of Rust code, and the standard library contains an additional 500 000 lines. And that’s without the 200+ external Rust crate dependencies used by the compiler! ↩ -
Just kidding (although I really have no idea where is that machine located
). ↩