Adding runtime benchmarks to the Rust compiler benchmark suite
This post describes the design and implementation of a runtime benchmark suite for measuring the performance of Rust programs, which was recently added into the Rust compiler suite. I have recently blogged about how the whole benchmark suite works, so feel free to read that post first if you want to gather a bit more context.
I have worked on the runtime benchmark suite for almost a year, and my work was supported by
a grant
from the Rust Foundation and also by Futurewei. I’m very grateful to both! As always, I’m also thankful
to many people that have helped me with this project, such as @nnethercote, @lqd,
and @Mark-Simulacrum.
The Rust compiler (rustc) has had a “compilation time” benchmark suite for a long time. This benchmark
suite compiles a bunch of Rust crates with every new version of the compiler (basically after every
commit to the main branch) to check if the performance of rustc hasn’t regressed. This infrastructure
has been invaluable over the past years, as it both helps us quickly notice unexpected compiler performance
regressions, and it also gives us confidence that the performance of the compiler is steadily improving
over time.
Compilation times are very important, as they are often cited as one of the primary sources of frustration by Rust developers. However, another crucial promise of Rust is that it generates efficient programs. The existing benchmark suite did a great job of notifying us of regressions to compilation performance, but it couldn’t tell us much of runtime performance, i.e. the performance of Rust programs compiled by a given version of the Rust compiler.
The rest of this post describes the steps I took to implement support for an MVP (minimum viable product)
version of runtime benchmarks into rustc-perf, the Rust compiler benchmark suite.
Were there really no runtime benchmarks before?
Now, you might be wondering whether Rust really had no runtime performance benchmarks before my
project, as that seems unlikely. And indeed, the compiler, and especially the standard library,
has lots of benchmarks
that leverage the normal Rust benchmark machinery (using the #[bench] attribute and cargo bench).
However, these benchmarks are microbenchmarks that usually measure only very small pieces of Rust
code (for example, common iterator adaptor chains). But most importantly, these microbenchmarks are
executed only manually by rustc developers, typically when they are trying to optimize some part
of the standard library or the compiler.
Such benchmarks are definitely useful, however they are slightly orthogonal to what we wanted to
achieve with runtime benchmarks in rustc-perf. Our goals could be summarized with the following
two requirements:
- Run benchmarks automatically Same as with the compilation time benchmarks, we want to have a set of benchmarks that execute automatically, after every commit. That is the only way to find truly unexpected performance regressions.
-
Include “real-world” code Again, similar to the compilation time suite, which includes several
popular real-world crates (like
syn,serdeorregex), we would like to measure more realistic pieces of Rust code. Not necessarily whole programs, as that would probably be too slow, but at least some interesting parts of actual programs that are larger than microbenchmarks likevec.iter().filter(..).map(..).collect().
The idea of runtime benchmarks in rustc-perf isn’t new, as the idea has been floated around more
than seven years ago. A comprehensive runtime
benchmark suite called lolbench was even created ~5 years ago.
However, it wasn’t integrated into rustc-perf, so it was not running automatically after each
commit, and its development was eventually discontinued.
During the last year, I have started contributing a lot to rustc-perf, and I thought that runtime
benchmarks would be a nice addition to our benchmark suite, so approximately one year ago, I set out
to make this idea a reality. I didn’t expect that it would take until the summer of this year to
implement an MVP version, but alas, that happens. Below I’ll describe the whole implementation process
step by step.
Runtime benchmark design
First, I needed to figure out how would the runtime benchmarks be measured and defined. Since we already had a lot of infrastructure and mechanisms for compilation time benchmarks, I decided to model the runtime benchmarks after them, so that we could better reuse our command-line interface, database schema and also web UI.
Therefore, I decided on the two following things:
- Each runtime benchmark would have a unique name, and a set of configuration parameters. For simplicity,
I didn’t actually add any parametrization to runtime benchmarks yet, so for now everything is just
compiled with
--release, but in the future we can experiment with parametrizing e.g. link-time optimizations (off/thin/fat), amount of codegen units used for compilation, panic strategy (unwind/abort) or even the used codegen backend (llvm/cranelift/gcc). - We would measure multiple metrics for each runtime benchmark, same as for compilation benchmarks.
For start, I decided on the following metrics:
- Wall time
- Instruction count
- Cycle count
- Cache misses
-
Branch misses
Especially the instruction count metric is important, since it tends to be quite stable, which makes it ideal for comparisons between two benchmark artifacts and finding regressions.
After deciding on this initial design, I wanted to start implementing code for defining and running
the benchmarks locally using rustc-perf, so that we could experiment with it before integrating it
into the perf.RLO server, database, GitHub bot, etc. As is often the case, when you need to
make large changes to an existing codebase, it might be a good idea to refactor it first. The part
of rustc-perf which actually executes benchmarks (called the collector) has evolved quite…
organically over the years, so instead of just piling additional code and special cases on top of it,
I decided to first refactor it quite substantially, to make follow-up work easier. This was done in
#1435 and #1440.
Aside: a tip for approaching refactoring
When performing refactoring, sometimes it goes like this:
Ok, I need to refactor this struct to make it easier to use. Oh, it’s also used by this function, which is too long, let’s split it. Hmm, after splitting that function, one of its parts should really be moved to a separate module. Damn, this module is big and complicated, let’s untangle it. Wait, this module uses a familiar struct… right, that’s the thing that I wanted to refactor in the first place!
When you start refactoring a codebase, it can be tempting to go deeper and deeper into the rabbit hole
and rewrite too many things at once. This can sometimes lead to a messy situation where your codebase
is in a half-rewritten, half-broken code, it’s hard to go forward or backwards and sometimes the only
way out is to git checkout and start the refactoring from scratch. This has happened to me a few
times, so I try to be more careful and use the following approach:
- Start refactoring something, ideally with a small scope.
- When I find in the process of refactoring that I also need (or want) to refactor something else,
I put the previous refactoring aside by using
git stash, and recurse back to step 1. - I finish the refactoring and create an individual commit. If I have put any previous refactorings
aside before (in step 2), I restore the latest one with
git stash popand go back to step 1.
With this approach, I always refactor only a single thing, and I don’t have to deal with a broken
codebase, because at the beginning of each refactor I start with a clean slate thanks to git stash.
An additional benefit is that this produces PRs with a lot of small commits that do atomic things,
which makes it easier for reviews (in my experience). #1435
and #1440 were performed using this strategy.
Benchmark definition
After the initial refactoring was completed, I needed to decide how will we actually define the
benchmarks and what tool we should use to gather the execution metrics. Both cargo bench and
criterion are not a bad choice for running benchmarks, but they only measure wall-time,
while I also wanted to measure hardware counters.
I was considering to use iai for a while. However, it uses Cachegrind
for the measurements, while I wanted the benchmarks to be executed natively, without simulation.
Also, using Cachegrind wouldn’t produce realistic wall-time results.
In the end, I decided to write a small library called
benchlib,
so that we would have ultimate control of defining, executing and measuring the benchmarks, instead
of relying on external crates. benchlib uses Linux perf events to gather hardware metrics, using
the perf-event crate. I also took bits and pieces from
other mentioned tools, like the
black_box
function from iai.
The next step that I had to figure out was how would the benchmarks be defined. For compilation time
benchmarks, it’s quite simple — you just point rustc to a crate, which is the benchmark itself,
since we measure compilation time. Initially, I also wanted to create a separate crate for each runtime
benchmark, but I quickly realized that it would take too long to compile (there could be tens or hundreds
of runtime benchmarks eventually), and that it would make contributing to the runtime benchmark suite
more complicated, because you would need to create a whole new crate for each benchmark.
Therefore, I decided to create “benchmark groups”. Each benchmark group is a single crate that defines
a set of runtime benchmarks that share dependencies and that topically belong together. For example,
the hashmap
benchmark group defines a set of benchmarks related to hash maps. By putting more benchmarks into a
single crate, we can amortize the compilation cost and make sure that related benchmarks use identical
dependencies (e.g. that all the hashmap benchmarks use the same version of
hashbrown). It does complicate some things, e.g. you need
to execute the benchmark group first to enumerate the benchmarks contained inside, and it also might
not always be clear into which group should a new benchmark be added. But I think that it is worth it
the reduced compilation time.
Finally, I needed to figure out some way of actually defining the benchmark code. I experimented with
several approaches, e.g. using macros or self-contained functions. In the end, I settled on using
closures, which could access a pre-initialized state for the benchmark from the outside (inspired by
criterion), to avoid re-generating certain inputs for the benchmark repeatedly, thus saving
time1. This is how it currently looks like:
fn main() {
    run_benchmark_group(|group| {
        // Calculates the N-body simulation.
        // Code taken from https://github.com/prestontw/rust-nbody
        group.register_benchmark("nbody_5k", || {
            let mut nbody = nbody::init(5000);
            || {
                for _ in 0..10 {
                    nbody = nbody::compute_forces(nbody);
                }
                nbody
            }
        });
    });
}
I’m not sure if it’s an ideal way, and so far no one else other than me has added a benchmark to the
suite ![]() So it’s possible that we will change it later. But for the MVP, it was good enough.
So it’s possible that we will change it later. But for the MVP, it was good enough.
If you’re interested, the scheme described above, and a short guide on adding new runtime benchmarks is described here.
The initial infrastructure for runtime benchmarks, containing a new CLI command added to collector
for executing runtime benchmarks, the benchlib library and two basic benchmarks was added in
#1423. The initial benchmark set contained
a few hashmap benchmars inspired by the Comprehensive C++ Hashmap Benchmarks 2022
blog post, one benchmark for a past performance regression
and finally an n-body simulation
(added in #1459).
After the initial PR, I implemented several additional CLI flags, like benchmark filtering or
choosing iteration count (#1453,
#1468, #1471),
made the CLI output nicer (#1463,
#1467,
#1477),
modified benchlib (#1464,
#1465), added CI support
(#1461, #1469,
#1475),
performed some additional refactoring (#1472)
and finally implemented storage of the results into a local database
(#1515).
After all that (by the beginning of 2023), it was possible to run a simple set of runtime benchmarks
locally using rustc-perf, and store the results into a SQLite database.
Rewriting the website
Once we were able to measure runtime benchmarks locally, I set out to work on the website integration.
The perf.RLO website consisted of several indepedent static HTML webpages containing a bunch of
copy-pasted code. Most of the interactive functionality was implemented with vanilla JavaScript,
and the most complicated page (the compare page, which compares two rustc artifacts) was implemented
in Vue,
with all the components bundled within a single .html file. In other words, the code had a lot of
technical debt and wasn’t easy to modify.
The website wasn’t changing often2, so the fact that it wasn’t very maintainable
wasn’t really causing problems. However, I knew that adding runtime benchmarks to the site would
require large changes, which I really didn’t want to make to that codebase. Especially since the
runtime UI would probably reuse a lot of stuff with the compilation time UI, and sharing components
elegantly wasn’t really possible. Therefore, I decided to do the favourite act of all programmers that
have to work with code written by someone else — rewrite it ![]() .
.
My first plan was to go All in™ and turn the website into a monstrous Single-page application (SPA)
with the help of create-react-app or something like that. However, this plan was met with…
some skepticism
![]() . Apart from being deployed on perf.RLO, the website is also used by
some developers locally, to test the performance of their local versions of
. Apart from being deployed on perf.RLO, the website is also used by
some developers locally, to test the performance of their local versions of rustc that they hack
on. Before, since the website was just a bunch of static .html and .js pages, it was enough to
execute cargo run and the website would show up. However, if I was to convert it to a full
“modern frontend application”, it would mean that these developers would have to install
npm and use some additional commands to get the website working.
I wasn’t really sure how to resolve this situation. One of the suggestions was to just use modern ECMAScript supported by the browser to avoid the need for a Javascript/Node.js-based build system. I explored this option, and I was pleasantly surprised at what can be nowadays supported in browsers natively3. However, one of my main use-cases was to support sharing of components, and that still wasn’t trivial without a build system. I have looked at web components, which actually looked quite nice, until I realized that I couldn’t pass arbitrary JS expressions as component props (all props were basically stringified), which has reduced their appeal to me significantly. Furthermore, I really wanted to use TypeScript, because I knew that I wanted to refactor a non-trivial amount of code in a codebase without any tests, and types could really help with that4. And using TypeScript basically means having to use some kind of build system.
I even considered to use some Rust frontend framework, like Yew or Dioxus. However, it would mean that I would have to rewrite the considerable amount of UI code already present in the web, which would be cumbersome. And I also didn’t feel like experimenting with (still heavily) evolving frameworks in this project, to avoid rewriting the UI again in a year.
Adding server side templates
To avoid making large disruptive changes outright, I decided to start with something smaller, and get rid of some of the duplication in the HTML pages by using some basic server-side template rendering. I started with the askama template engine, however after experimenting with it, I realized that it’s not a good fit for website development, because it cannot rebuild the templates on the fly. This means that everytime I (or someone else) wanted to make some changes to the website frontend, the website binary would have to be rebuilt, which is very far from an interactive experience. I thus decided to go with the tera crate instead, which allows re-rendering templates from the filesystem while the program (in our case the website) is running. To make it more efficient, I implemented a scheme where in debug mode, the website reloads templates from the disk (so that development iteration is quick), and in release mode the templates are loaded just once and then cached forever (so that the website is more efficient). This was implemented in #1539, where the simplest page (help page) was ported to the template engine. This was later extended to the rest of the website’s pages in #1542, #1543, #1545 and #1548.
This was a good start, as it allowed us to get rid of some duplication and clean up the HTML pages a bit.
However, it didn’t really solve my problem with reusing components and using TypeScript, of course.
After thinking about it a bit more, I decided that introducing a build system is the only solution
that would satisfy my needs, and that could hopefully also attract more frontend contributors
to the rustc-perf project5. But what about the developers that wanted to avoid
npm? Well, I remembed the ancient adage: If the developer won't come to npm, then npm must go to
the developer. In other words, I needed to provide the website to rustc developers without
requiring them to install npm themselves.
I took inspiration from rustc itself and decided to implement nightly builds of rustc-perf. These
would be compiled every day on CI and published as GitHub releases, which developers could simply
download and use locally, without having to build it themselves. Since most of the developers don’t
ever change the website code, and they just want to use it, this seemed like an ideal solution. One
annoyance with this was that the website binary was loading templates and other static files (.js,
.css etc.) from the disk, so distributing the website meant sharing a whole archive of files. If
only there was some way of embedding these files into the binary itself… Turns out, there is! I found
the awesome rust-embed crate, using which you can embed pretty much any file directly into
your Rust binary, and then load it during runtime from the binary (or rather from some data segment
in memory) itself. I implemented this embedding in #1554
(and later extended in #1605 to embed
some additional data), and then added a CI workflow for nightly builds in #1555. With these
changes in place, I got the green light to finally add npm to the project ![]() .
.
npm go brrrr
Now that I could finally add a build system, I had just a single, tiny problem - actually choosing which build system to use. If you know anything about the “modern JavaScript ecosystem”, you know that this problem is as easy as combining aliasing with mutability in Rust — it’s not very easy at all. Webpack, Parcel, Vite, Rollup, Esbuild, Snowpack, bun, oh my… I started by listing some requirements that I would have for the build system:
- The website already contained some Vue code, and I wanted to use TypeScript, so it should support both, and also their combination! I also wanted support both for Vue Single-file components (SFC), and for embedding JSX components within the Vue SFC files.
- Other developers have expressed a desire (which I share) to have the build system be “zero config”, to avoid maintaining hundreds of lines of configuration files (looking at you, Webpack).
- It would have to support a “multi-page application” (MPA) mode. I didn’t want to turn the web into a full-fledged SPA. Instead, I wanted to bundle each page as a separate self-contained mini-application, while still having the option to share code, styles and components between the individual pages.
After trying to create a simple project in several of the mentioned build systems, I decided to go with Parcel. It is near zero config, supports the MPA use case relatively well and all the mentioned Vue and TypeScript wizardry was working in it out of the box. Apart from one issue6, it has worked fine, and I have been satisfied with the choice so far.
The new build system was implemented in #1565 7. After that, I have ported the rest of the pages to the new system, adding types where possible, refactoring and cleaning up the code, and completely restructuring the Vue implementation of the compare page to make it easier to understand and modify (#1570, #1573, #1577, #1581, #1590, #1573). After that, I added some additional CI infrastructure (#1594, #1601), updated documentation to match the new frontend build system (#1588, #1596, #1603) and fixed some regressions introduced by the rewrite (#1583, #1593).
This whole ordeal took several months by the way, which was one of the reasons why it took me so long to implement the MVP of runtime benchmarks. Sometimes refactoring of old code is more time-consuming than writing the new code :)
Implementing UI for runtime benchmarks
After the frontend was finally in a reasonable state, I started working on adding support for visualizing the results of runtime benchmarks. First, this required some non-trivial changes to DB querying in the site’s backend, so that we could query compilation time and runtime results in a unified way (#1608, #1610). After that, I generalized the UI of the compare page, so that we could show more structured information on the page, by adding tabs in #1612:
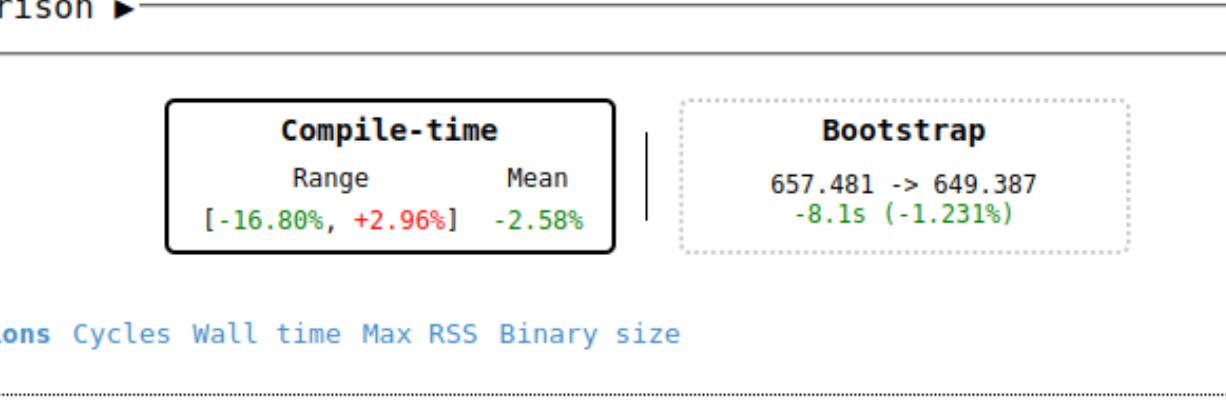
and then finally added a new runtime benchmarks tab with a simple table that shows their measured results in the comapre page in #1620. I slightly extended this table with filters in #1650, however the interface is still quite basic and runtime benchmarks are also not yet integrated into the other pages, like the dashboard or into graphs (contributions are welcome, as always :) ).
Continuous integration
At this point, we were able to execute runtime benchmarks, store their results into the database and display the results on the website. The last missing piece for the MVP was to actually run the benchmarks on the benchmarking machine after every master commit.
First, in #1630 I implemented support for executing runtime benchmarks for published artifacts (stable and beta) releases. These are benchmarked sporadically, so I wanted to start with them to make sure that everything is working, before enabling runtime benchmarks for all commits. Turns out that everything was not, in fact, working, so I had to perform some additional refactorings and fixes, both to runtime benchmarks and also to the benchmarking of the stable artifacts themselves (#1629, #1636, #1637, #1641, #1642, #1651).
After that work was done, we finally flipped the switch to execute runtime benchmarks by default
on each master commit and try build in #1662
![]() . It’s a satisfying feeling to merge a ~20 line PR that enables something that you have been
preparing for almost a year :) The original issue #69,
which asked for runtime benchmarks to be added to
. It’s a satisfying feeling to merge a ~20 line PR that enables something that you have been
preparing for almost a year :) The original issue #69,
which asked for runtime benchmarks to be added to rustc-perf, was thus closed after mere…
checks notes 7 years :)
Adding more benchmarks
In parallel with refactoring the web and integrating the benchmarks into our CI, I have also been adding new runtime benchmarks. I tried to take inspiration from several sources, mostly from lolbench (the original runtime benchmark suite) and also from some benchmarks mentioned by Niko Matsakis in the original issue. Here is a list of benchmarks that I have added to the suite. Note that some of them might be overlapping, or just not very good at all.
Building the suite is still a work in progress, and if you have interesting benchmark candidates, I would like to hear about them! :)
- Regex (#1639): benchmarks matching of two simple regular expressions using the regex crate.
- Raytracer (#1640): benchmarks a raytracer that renders a simple scene. This is probably currently my favourite benchmark, because it measures an actual (and useful) Rust program, rather than just an artificial usage of some crate.
- Brotli (#1645): benchmarks
compression and decompression of ~10 MiB of text8 with the Brotli compression algorithm
using the
brotlicrate. - nom (#1646): benchmarks parsing of JSON using the parser-combinator framework nom.
- fmt (#1653): benchmarks the performance of
the
std::fmtformatting machinery, by formatting a struct with that uses#[derive(Debug)]and by using thewrite!macro to write into aStringbuffer. This benchmark is sadly just a stub, and it should be eventually extended with many more formatting use-cases. The formatting machinery is currently undergoing a major rewrite and I hope that this group of benchmarks will eventually serve as a guideline to test its performance effects on real Rust programs. - CSS parsing (#1655): benchmarks the parsing of a 5 MiB CSS file that I copy-pasted from the Facebook website. The parsing is performed using the lightningcss crate, which is used by Parcel to parse and minify CSS.
- SVG parsing and rendering (#1656): benchmarks
parsing of a ~30 MiB SVG file from Wikipedia,
and also its rendering into a
1024x1024bitmap image. Both operations use the resvg crate.
During the course of implementing these benchmarks, I also performed some additional changes and refactorings to the runtime benchmark machinery (#1604, #1638, #1644), apart from other things to make it easier to define the benchmarks.
Regression analysis tools
After the MVP was merged, we had a set of runtime benchmarks that were being executed on each master commit. However, when the first regression has appeared, I realized that we don’t have any tooling to help us diagnose what is going on, and whether the regression is just noise or not. For compilation time benchmarks, we have a wide range of tools for profiling the compiler, but for runtime benchmarks we had none. To fix this, I implemented two separate commands to help us profile runtime benchmarks:
-
Cachegrind diff (#1695). Cachegrind is a very useful tool for profiling programs, and specifically also for comparing the execution traces of two slightly different versions of the same program, to find out in what functions did they spend the most time (or rather executed the most instructions). We already use it extensively to compare diffs of compilation time benchmarks compiled by two versions of
rustc. In the linked PR, I generalized its usage so that we could also compare two executions of a runtime benchmark compiled with two versions ofrustc.One complication that I found is that for compilation benchmarks, we want to measure the whole compilation using Cachegrind. However, for runtime benchmarks, we ideally only want to measure the part of the program where the actual benchmark is executed, and not the whole “benchmark library ceremony” around it. Valgrind has support for client requests, which allow the profiled program (amongst other things) to selectively enable and disable instrumentation for parts of the program. It was implemented for Callgrind, and there is even a nice crate called crabgrind that allows using the requests from Rust code. However, I found out that the requests were not implemented for Cachegrind. Luckily, one of my colleagues from the Compiler performance working group is none other than Nicholas Nethercote, the author of Cachegrind
 ! I asked him about this, and he was kind enough to implement support for client
requests into Cachegrind to support our use-case. I then added support for these requests into
crabgrind in this PR. The requests are not yet actually
used by our runtime benchmark library, but I have a branch with it and plan to send a PR to
! I asked him about this, and he was kind enough to implement support for client
requests into Cachegrind to support our use-case. I then added support for these requests into
crabgrind in this PR. The requests are not yet actually
used by our runtime benchmark library, but I have a branch with it and plan to send a PR to rustc-perfsoon. -
Codegen diff (#1697). I was thinking about what other information could be useful to us to find out the source of a regression. Sometimes, it can be interesting to look at the differences in the generated code, so I created a “codegen diff” command, which compares assembly, LLVM IR or MIR for all functions of a given benchmark compiled by two versions of
rustc. It uses the great cargo-show-asm cargo subcommand for getting the actual codegen contents. The diff is printed to stdout in a simple way, so it’s nowhere near as nice as e.g. Compiler explorer. Nevertheless, I think that it can be quite useful for investigating regressions.After using the codegen diff to investigate an actual regression, I realized that it would be also nice to see the difference in sizes of the individual functions. If the same function suddenly becomes much larger, it can hint to an unexpected codegen regression. I implemented that in #1721.
Next steps
As I stated before, the implemented version of runtime benchmarks is an MVP, which works, but also lacks many things. Runtime benchmarks should be integrated into the other pages of the website, their UI in the compare page should be extended, e.g. with guides on how to run codegen or cachegrind diff locally, more tools for analyzing the performance of the benchmarks could be added, and perhaps most importantly, the runtime benchmark suite itself should be improved and extended. As always, there is a lot of stuff to do :)
Conclusion
If you have any comments or questions about the runtime benchmarks, or you want to suggest your
own benchmarks to be added to the suite, let me know on Reddit or send a PR to
rustc-perf.
-
And in some cases, also achieving more stability, because the benchmark input won’t be allocated on a new location on the heap before each benchmark execution. ↩
-
I think that it hasn’t been changing much exactly because it wasn’t very easy to modify :) ↩
-
I have started with web development more than ten years ago and I remember having to support Internet Explorer 7 and similar shenanigans, so it blows my mind that e.g. async functions are now supported in the vast majority of browsers natively. ↩
-
Not to mention that I consider writing apps that need to be reliable and that are depended upon by many people in languages without static typing and a reasonable type system to be just a Bad idea™, overall. ↩
-
Spoiler alert: no new contributors have cropped up so far
 However,
the new refactored frontend actually made it simpler for some existing contributors (not just me)
to modify the website, which resulted in several new UI PRs being sent to the site. ↩
However,
the new refactored frontend actually made it simpler for some existing contributors (not just me)
to modify the website, which resulted in several new UI PRs being sent to the site. ↩ -
In certain cases, it was “miscompiling” the JS bundle, causing opaque JS errors originating in Parcel. This was probably caused by our somewhat unorthodox MPA setup. After some trial and error, I found out that disabling HMR (hot module replacement) fixed the problem. ↩
-
The diff of that PR might look scary, but most of it was only just the contents of the
package-lock.jsonlockfile. Without it, the diff was ~150 lines. ↩ -
Namely, the adventures of Sherlock Holmes :) ↩