What part of Rust compilation is the bottleneck?
Rust compilation times is an ongoing topic that generates many discussions online1. Most people don’t really care about what exactly takes time when compiling Rust program; they just want it to be faster in general. But sometimes, you can see people pointing fingers at specific culprits, like LLVM or the borrow checker. In this post, I’ll try to examine who is the culprit in various situations, based on data gathered from a fun little experiment.
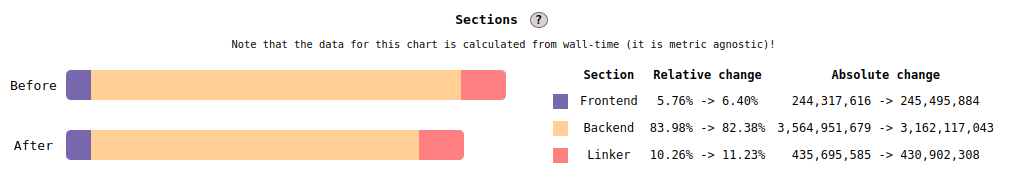
I started thinking about this a few months ago. To see a break-down of the compilation, I added a new form of visualisation to the Rust compiler benchmark suite. For each benchmark, it now shows us the ratio of time spent in three individual high-level “sections” of compilation:
- Frontend: lexing, parsing, macro expansion, type checking, trait solving, borrow checking, MIR optimization, metadata generation, etc.
- Backend: code generation (currently using LLVM).
- Linker: linking of the final artifact (currently using the default Linux
bfdlinker).
It looks something like this:
I added this visualization because I think that it is useful to keep in mind where should we focus
our optimization efforts, and also to understand which parts of the compilation form the bottleneck
in various situations. Note that the code that decides what belongs into the frontend, backend and linker
parts is basically a heuristic, since there is no unambiguous and official definition of these terms for
rustc. The data is extracted out of query traces recorded by the compiler’s self-profile machinery.
Top 100 crates experiment
I was curious to see the broader story of the duration spent in the individual sections, so I borrowed @lqd’s scripts for downloading crates to run a simple experiment. Using the crates_io_api crate, I downloaded the 100 most popular crates from crates.io, added them as benchmarks to a local copy of the benchmark suite, and gathered self-profile data by compiling them with a recent nightly compiler. Using some pandas and seaborn-fu, I then created a few charts that I will show below.
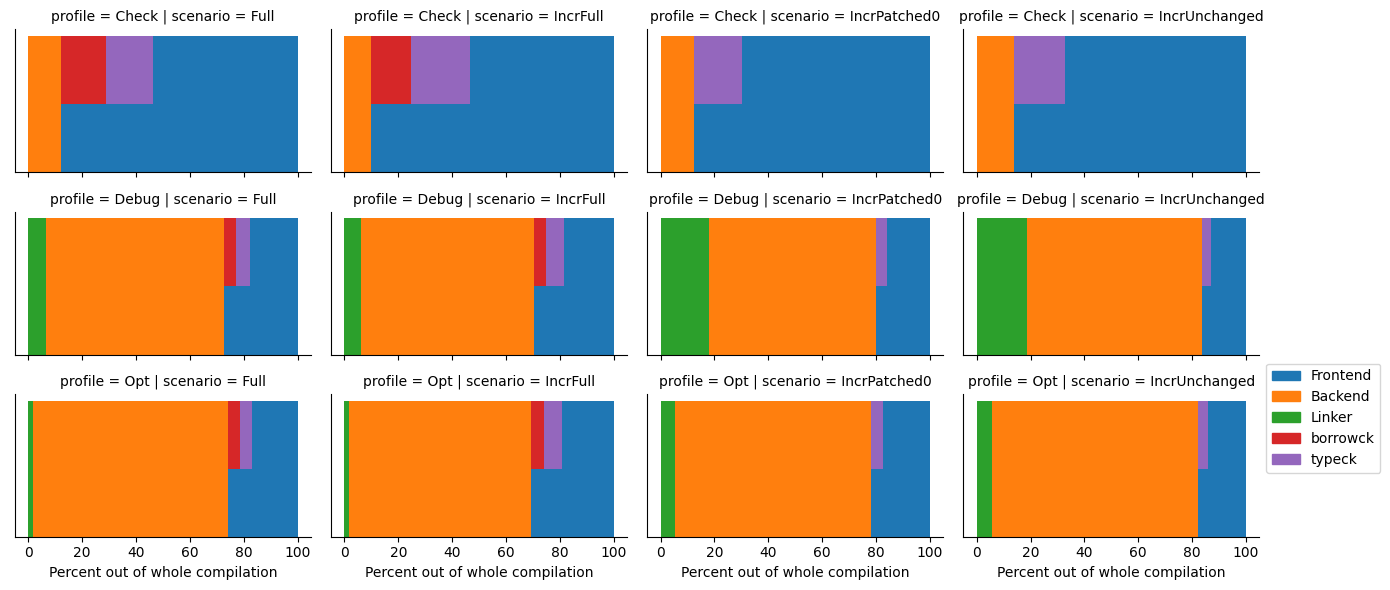
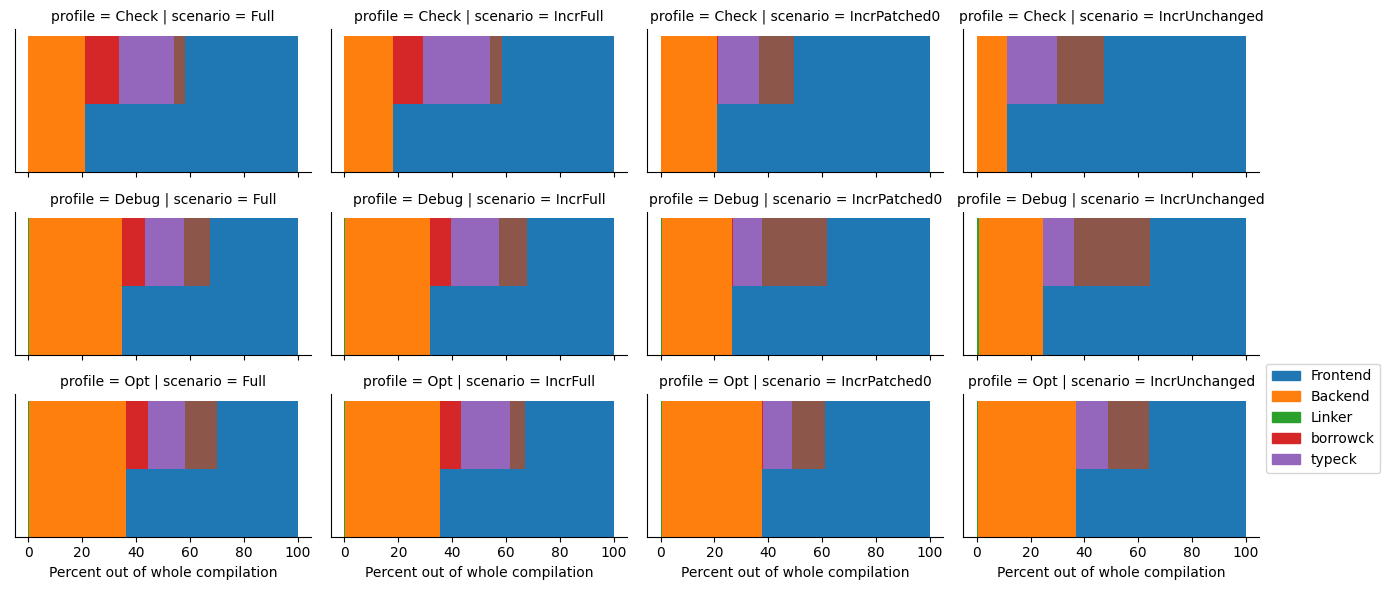
Each benchmark was executed in 12 different configurations, using three profiles (Check, Debug and Opt)
and four scenarios (Full, IncrFull, IncrPatched and IncrUnchanged). You can read more about profiles and scenarios in one of my previous blog posts. Only the leaf crate was benchmarked, the compilation of dependencies is not included in the measurement.
Disclaimer: it’s possible that my calculations of the sections weren’t 100% correct or that my PC had some noise, I didn’t worry too much about running the benchmarks multiple times. So take the results with a grain of salt :)
Binary crate (ripgrep)
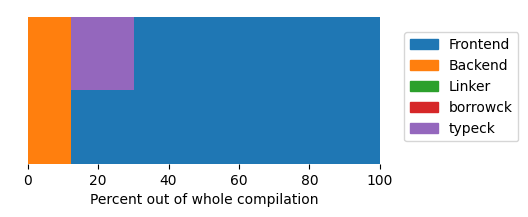
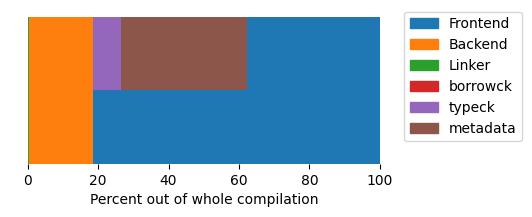
First, let’s take a look at a representative example, the compilation of the
ripgrep binary with the Debug profile and Full scenario (in other words, a clean debug non-incremental build)2:
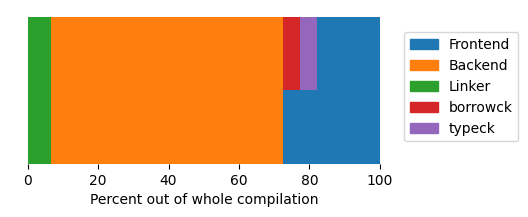
This is a (pretty ugly ![]() ) stacked bar chart, which shows the percentage of the individual sections out of the whole compilation.
The blue part is the frontend, which is further split into borrow checking and type checking, the orange part is the backend (so mostly LLVM),
and the green part is the linker.
) stacked bar chart, which shows the percentage of the individual sections out of the whole compilation.
The blue part is the frontend, which is further split into borrow checking and type checking, the orange part is the backend (so mostly LLVM),
and the green part is the linker.
The type checking and especially the borrow checking fraction were calculated with a pretty rough estimations, so I wouldn’t worry too much about them. The important part is the distinction between the frontend, backend and the linker.
In this case, it’s clear that most of the time is spent waiting on LLVM. It is also important to note that the frontend in this case runs on a single thread, while the backend part is parallelized by up to 16 threads! So, should we point the finger at LLVM? Not so fast.
Let’s take a look at another case. The same ripgrep binary, but this time an incremental debug (re)build
after a small change. The binary was first compiled normally (with incremental compilation enabled, which is the default in “debug mode”),
then a single dummy function was added to one of its source files, and then it was built again. This
chart shows the result of that rebuild:
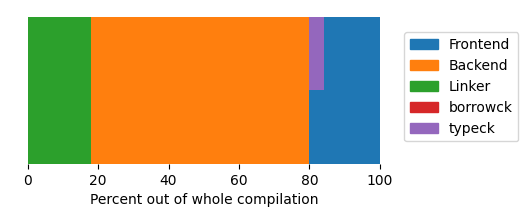
Note how the linker suddenly becomes a much larger bottleneck, since it is essentially the only
non-incremental part of the compilation now. Also notice how borrow checking has disappeared. I haven’t delved into this, but I think that it’s because rustc doesn’t redo work inside unchanged function bodies (which is where borrow checking happens) when doing an incremental rebuild.
For a larger binary, the linker fraction can be even larger, and can take substantial time. That is why using a different linker, like lld or mold, can help a lot to cut down incremental rebuild times.
Now the same incremental rebuild, but this time with optimizations (--release):
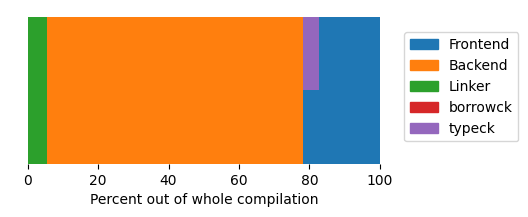
The backend now again takes a much large ratio, both because it does much more work when optimizations are enabled, and also because the linker has less work, because it doesn’t have to deal with debug info.
Note:
ripgrepactually usesdebug=1for its release profile, but I turned it off here to show the default case ofreleasewithout debuginfo.
And what if we don’t want to generate code, but just run cargo check? Then it will usually look something like this
(again, an incremental rebuild, as I consider that to be the most important case):
As expected, for cargo check, there is no linker part, and the frontend takes most of the time.
It’s interesting that even for cargo check, some part of what I classify as “backend” is still being executed.
I asked around on Zulip and it seems that it is needed to generate metadata.
For completeness, you can find all the measured configurations for the ripgrep binary
here.
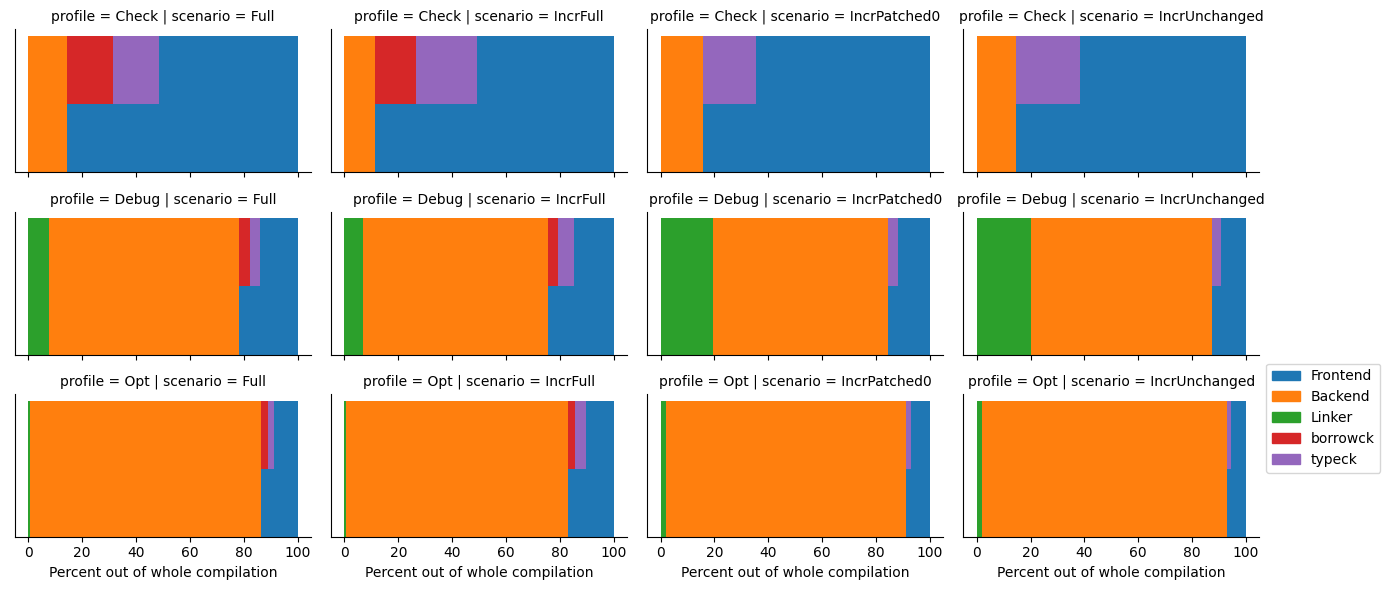
To have a more general picture, I also created the same chart for a few other binary crates
(hyperfine and dust)3
and averaged all of them together. You can find the result here.
In this averaged result, the backend takes even more time, since both hyperfine and dust use lto = true (so-called “fat LTO”), which makes the LLVM part brutally slow.
Library (regex-automata)
In order to see how do the ratios change when we compile a library instead, I measured the regex-automata crate. Here is the result for a Debug/Full build:
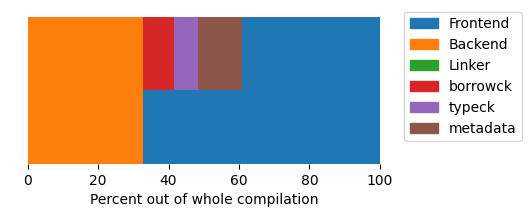
Okay, it seems that frontend can also sometimes be the “bad guy”. Note the new metadata section, which marks the generation of metadata that is then consumed by other Rust crates that depend on the given library.
What if we just make a small incremental change?
This time, the frontend takes an even larger fraction of the whole compilation.
Again, I ran the same experiment for multiple (~90) libraries, and averaged the results. You can find the result here. Compared to the averaged results from the binaries, for libraries the frontend takes a much larger fraction of the whole compilation time.
Based on what we have seen so far, it is clear that the bottleneck can be both in the frontend and the backend, depending on the thing that you are compiling.
Which artifact type is more important?
Based on the difference between the ratios between binaries and libraries, I think that it is interesting to think about what is actually the common case - do we compile libraries or binaries more often? It will of course depend on your specific use-case, but some general observations can be made.
One observation is that most of the crates in your crate graph (i.e. the dependencies of your project), with the exception of build scripts and procedural macros, will actually be libraries. However, at the same time, these crates are usually not compiled that often. They will be recompiled in clean builds (and on CI, if you don’t use caching, which you should!), and when you modify the used Cargo profile, compiler flags or even the version of the compiler. But during the typical “edit-build-run” cycle, where you repeatedly do incremental changes to your code and want to see the result as fast as possible, you will typically be stuck on compiling a binary artifact, not a library. It might either be a binary that you then execute directly, or a test harness that links to your library code and which you then repeatedly execute to run tests.
I personally consider the interactive edit-build-run cycle to be the biggest bottleneck when developing
Rust code, so at least for me, the binary case is much more interesting. That is also why I think that
the backend and the linker are the things that could be improved the most. ![]() for the
Cranelift backend and the usage of the
for the
Cranelift backend and the usage of the lld linker by default in the future!
EDIT: After writing the post and having some discussions on Reddit, I realized that the binary vs library distinction here is a bit misleading. What is actually important is if you are producing a linkable artifact (e.g. .exe or .so). Because if you just build an intermediate artifact (like an .rlib, which is what your crate dependencies compile into), that won’t compile #[inline]-d and generic functions, and also the linker won’t be involved. So a lot of the compilation costs will be actually deferred to the final artifact that needs to also monomorphize and compile inlined and generic functions, and also needs to perform linking. In many cases, the final artifact is indeed a binary, but it can also be e.g. a dynamic library object (.so or .dll), although this is not so common with Rust due to it not having a stable ABI.
What to do with this information?
To be honest, probably not that much. The section computation and the charts that I have shown here were created by a bunch of heuristics and ad-hoc scripts, and (AFAIK), rustc doesn’t compute this breakdown on its own. It would be cool if Cargo would be able to show you some summary of the bottlenecks that slow down the compilation of your crate(s), and guide you towards approaches that could reduce them, like this:
$ cargo build
  Compiling foo v0.1.0 (/tmp/foo)
    Finished dev [unoptimized + debuginfo] target(s) in 4.2s
   Note: you seem to be bottlenecked by the frontend, you might want
   to enable the parallel frontend.
And if it did that, it might then as well configure these optimizations for you :)
Conclusion
We saw that (as pretty much always) the answer to the question “what is the bottleneck” is “it depends” :)
I think that in the grand scheme of things, it doesn’t really matter that much what part of the compiler is the bottleneck,
as we (as in, people that contribute to rustc) should strive to improve the performance across the board. That being said, having a better idea of where does rustc spend most of the time when it compiles your code might be useful, for example to tune your project configuration to achieve better compilation times.
Now, if you don’t want to think about these things, and you just want to get the configuration for the fastest possible compilation times,
you can try my cargo-wizard tool, and use the fast-compile profile (if you’re not shy of using the nightly compiler, try it with the --nightly flag, to enable more optimizations).
And that’s all. If you’d like to examine the measured data, or run the experiment yourself, you can find my scripts here. And if you have any comments or questions, you can let me know on Reddit.
-
Excuse the ugly
matplotlibcharts, I didn’t want to spend too much time on making them nicer. ↩ -
I didn’t measure more binaries, because
rustc-perfisn’t really prepared for benchmarking crates that have both a library and a binary target (which happens a lot for crates that produce a binary), so I only benchmarked a few that mostly worked out-of-the-box. ↩